Enabling enterprise Telemetry on AWS: Handling massive data backfills using ECS and Databricks wi...
17 June 2026 - 1 min. read
Keidi Xhafa

When we approach modern Machine Learning problems in an AWS environment, there is more than traditional data preparation, model training, and final inferences to consider. Also, pure computing power is not the only concern we must deal with in creating an ML solution.
There is a substantial difference between creating and testing a Machine Learning model inside a Jupyter Notebook locally and releasing it on a production infrastructure capable of generating business value.
The complexities of going live with a Machine Learning workflow in the Cloud are called a deployment gap and we will see together through this article how to tackle it by combining speed and agility in modeling and training with criteria of solidity, scalability, and resilience required by production environments.
The procedure we’ll dive into is similar to what happened with the DevOps model for "traditional" software development, and the MLOps paradigm, this is how we call it, is commonly proposed as "an end-to-end process to design, create and manage Machine Learning applications in a reproducible, testable and evolutionary way".
So as we will guide you through the following paragraphs, we will dive deep into the reasons and principles behind the MLOps paradigm and how it easily relates to the AWS ecosystem and the best practices of the AWS Well-Architected Framework.
Let’s start!
As said before, Machine Learning workloads can be essentially seen as complex pieces of software, so we can still apply "traditional" software practices. Nonetheless, due to its experimental nature, Machine Learning brings to the table some essential differences, which require a lifecycle management paradigm tailored to their needs.
These differences occur at all the various steps of a workload and contribute significantly to the deployment gap we talked about, so a description is obliged:
Managing code in Machine Learning appliances is a complex matter. Let’s see why!
Collaboration on model experiments among data scientists is not as easy as sharing traditional code files: Jupyter Notebooks allow for writing and executing code, resulting in more difficult git chores to keep code synchronized between users, with frequent merge conflicts.
Developers must code on different sub-projects: ETL jobs, model logic, training and validation, inference logic, and Infrastructure-as-Code templates. All of these separate projects must be centrally managed and adequately versioned!
For modern software applications, there are many consolidated Version Control procedures like conventional commit, feature branching, squash and rebase, and continuous integration.
These techniques however, are not always applicable to Jupyter Notebooks since, as stated before, they are not simple text files.
Data scientists need to try many combinations of datasets, features, modeling techniques, algorithms, and parameter configurations to find the solution which best extracts business value.
The key point is finding ways to track both succeeded and failed experiments while maintaining reproducibility and code reusability. Pursuing this goal means having instruments to allow for quick rollbacks and efficient monitoring of results, better if with visual tools.
Testing a Machine Learning workload is more complex than testing traditional software.
Dataset requires continuous validation. Models developed by data scientists require ongoing quality evaluation, training validation, and performance checks.
All these checks add to the typical unit and integration testing, defining the concept of Continuous Training, which is required to avoid model aging and concept drift.
Unique to Machine Learning workflows, its purpose is to trigger retraining and serving the models automatically.
Deployment of Machine Learning models in the Cloud is a challenging task. It typically requires creating various multi-step pipelines which serve to retrain and deploy the models automatically.
This approach adds complexity to the solution and requires automating steps done manually by data scientists when training and validating new models in a project's experimental phase.
It is crucial to create efficient retrain procedures!
Machine Learning models are prone to decay much faster than "traditional" software. They can have reduced performances due to suboptimal coding, incorrect hardware choices in training and inference phases, and evolving data sets.
A proper methodology must take this degradation into account; therefore, we need a tracking mechanism to summarize workload statistics, monitor performances, and send alarm notifications.
All of these procedures must be automated and are called Continuous Monitoring, which also has the added benefit of enabling Continuous Training by measuring meaningful thresholds.
We also want to apply rollbacks when a model inference deviates from selected scoring thresholds as quickly as possible to try new feature combinations.
Machine Learning shares similar approaches to standard CI/CD pipelines of modern software applications: source control, unit testing, integration testing, continuous delivery of packages.
Nonetheless, models and data sets require particular interventions.
Continuous integration now also requires, as said before, testing and validating data, data schemas, and models.
In this context, continuous delivery must be designed as an ML training pipeline capable of automatically deploying the inference as a reachable service.
As you can see, there is much on the table that makes structuring a Machine Learning project a very complex task.
Before introducing the reader to the MLOps methodology, which puts all these crucial aspects under its umbrella, we will see how a typical Machine Learning workflow is structured, keeping into account what we have said until now.
Let’s go on!
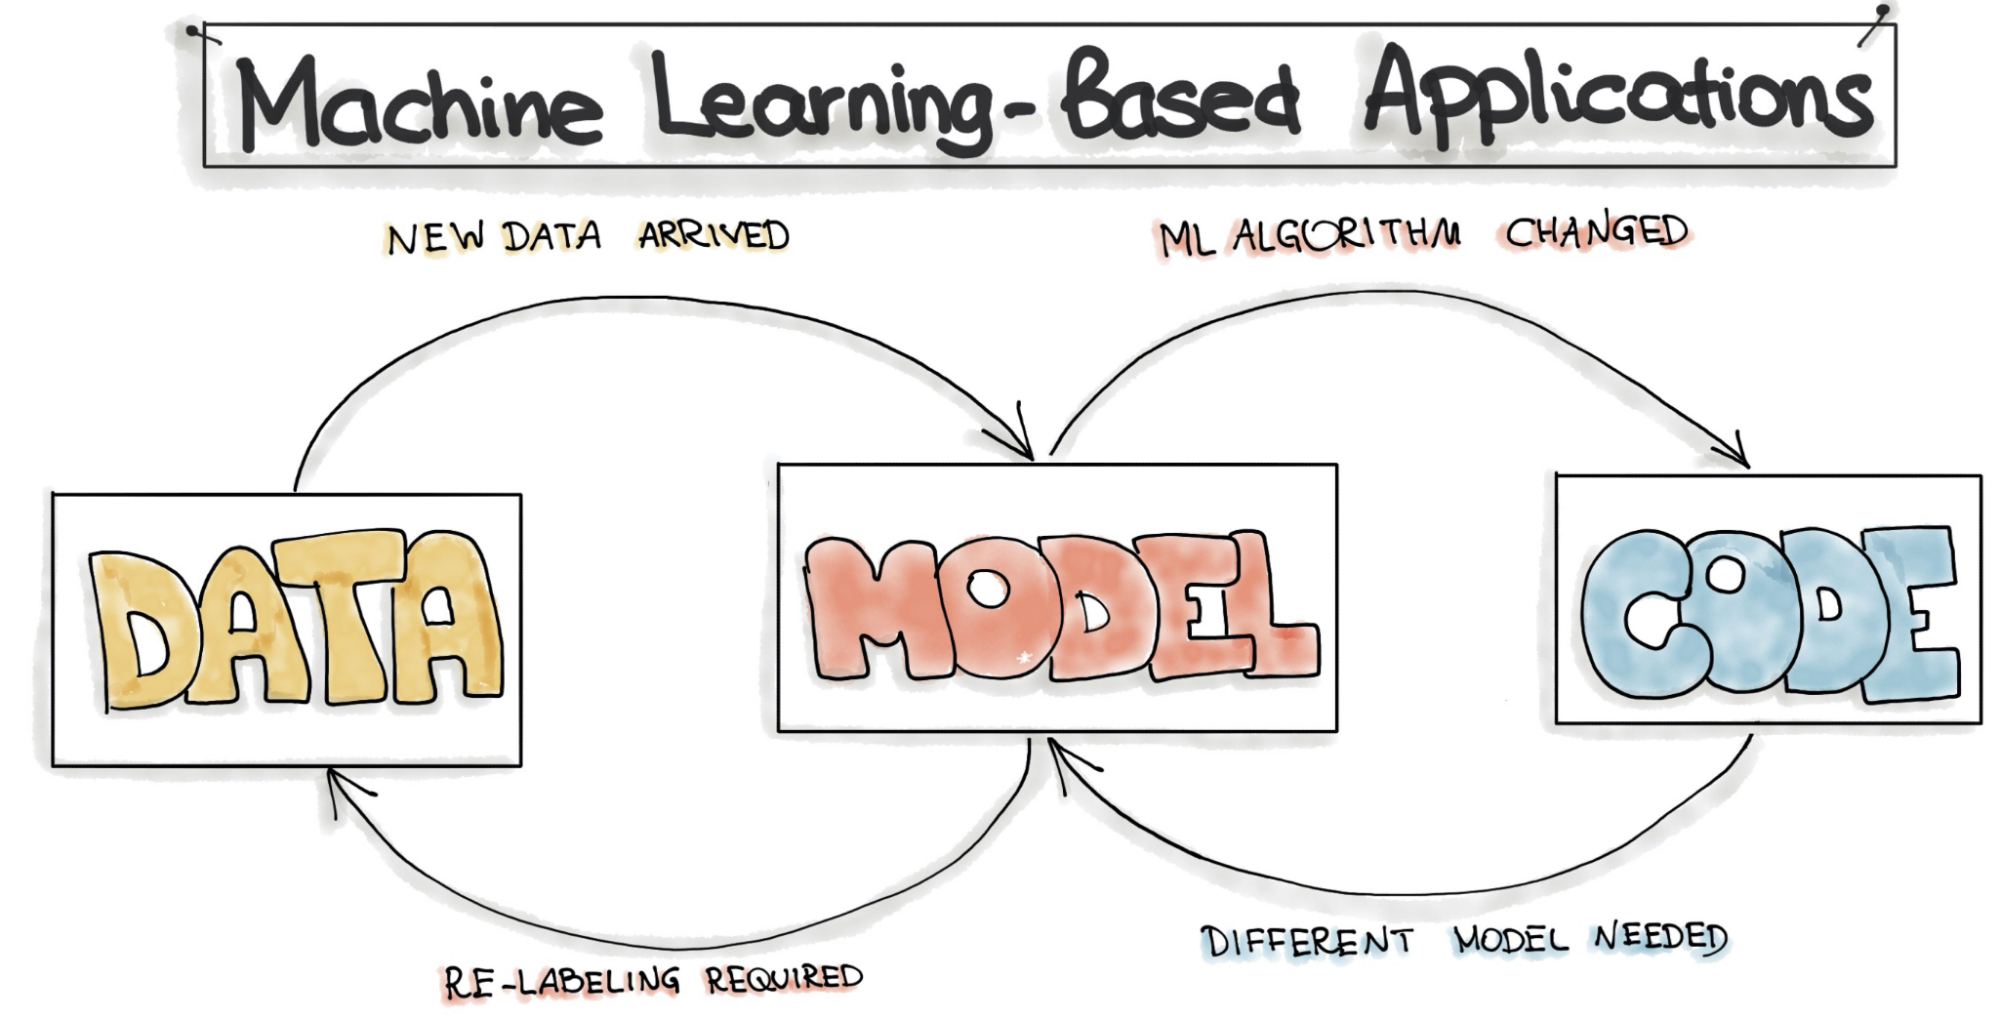
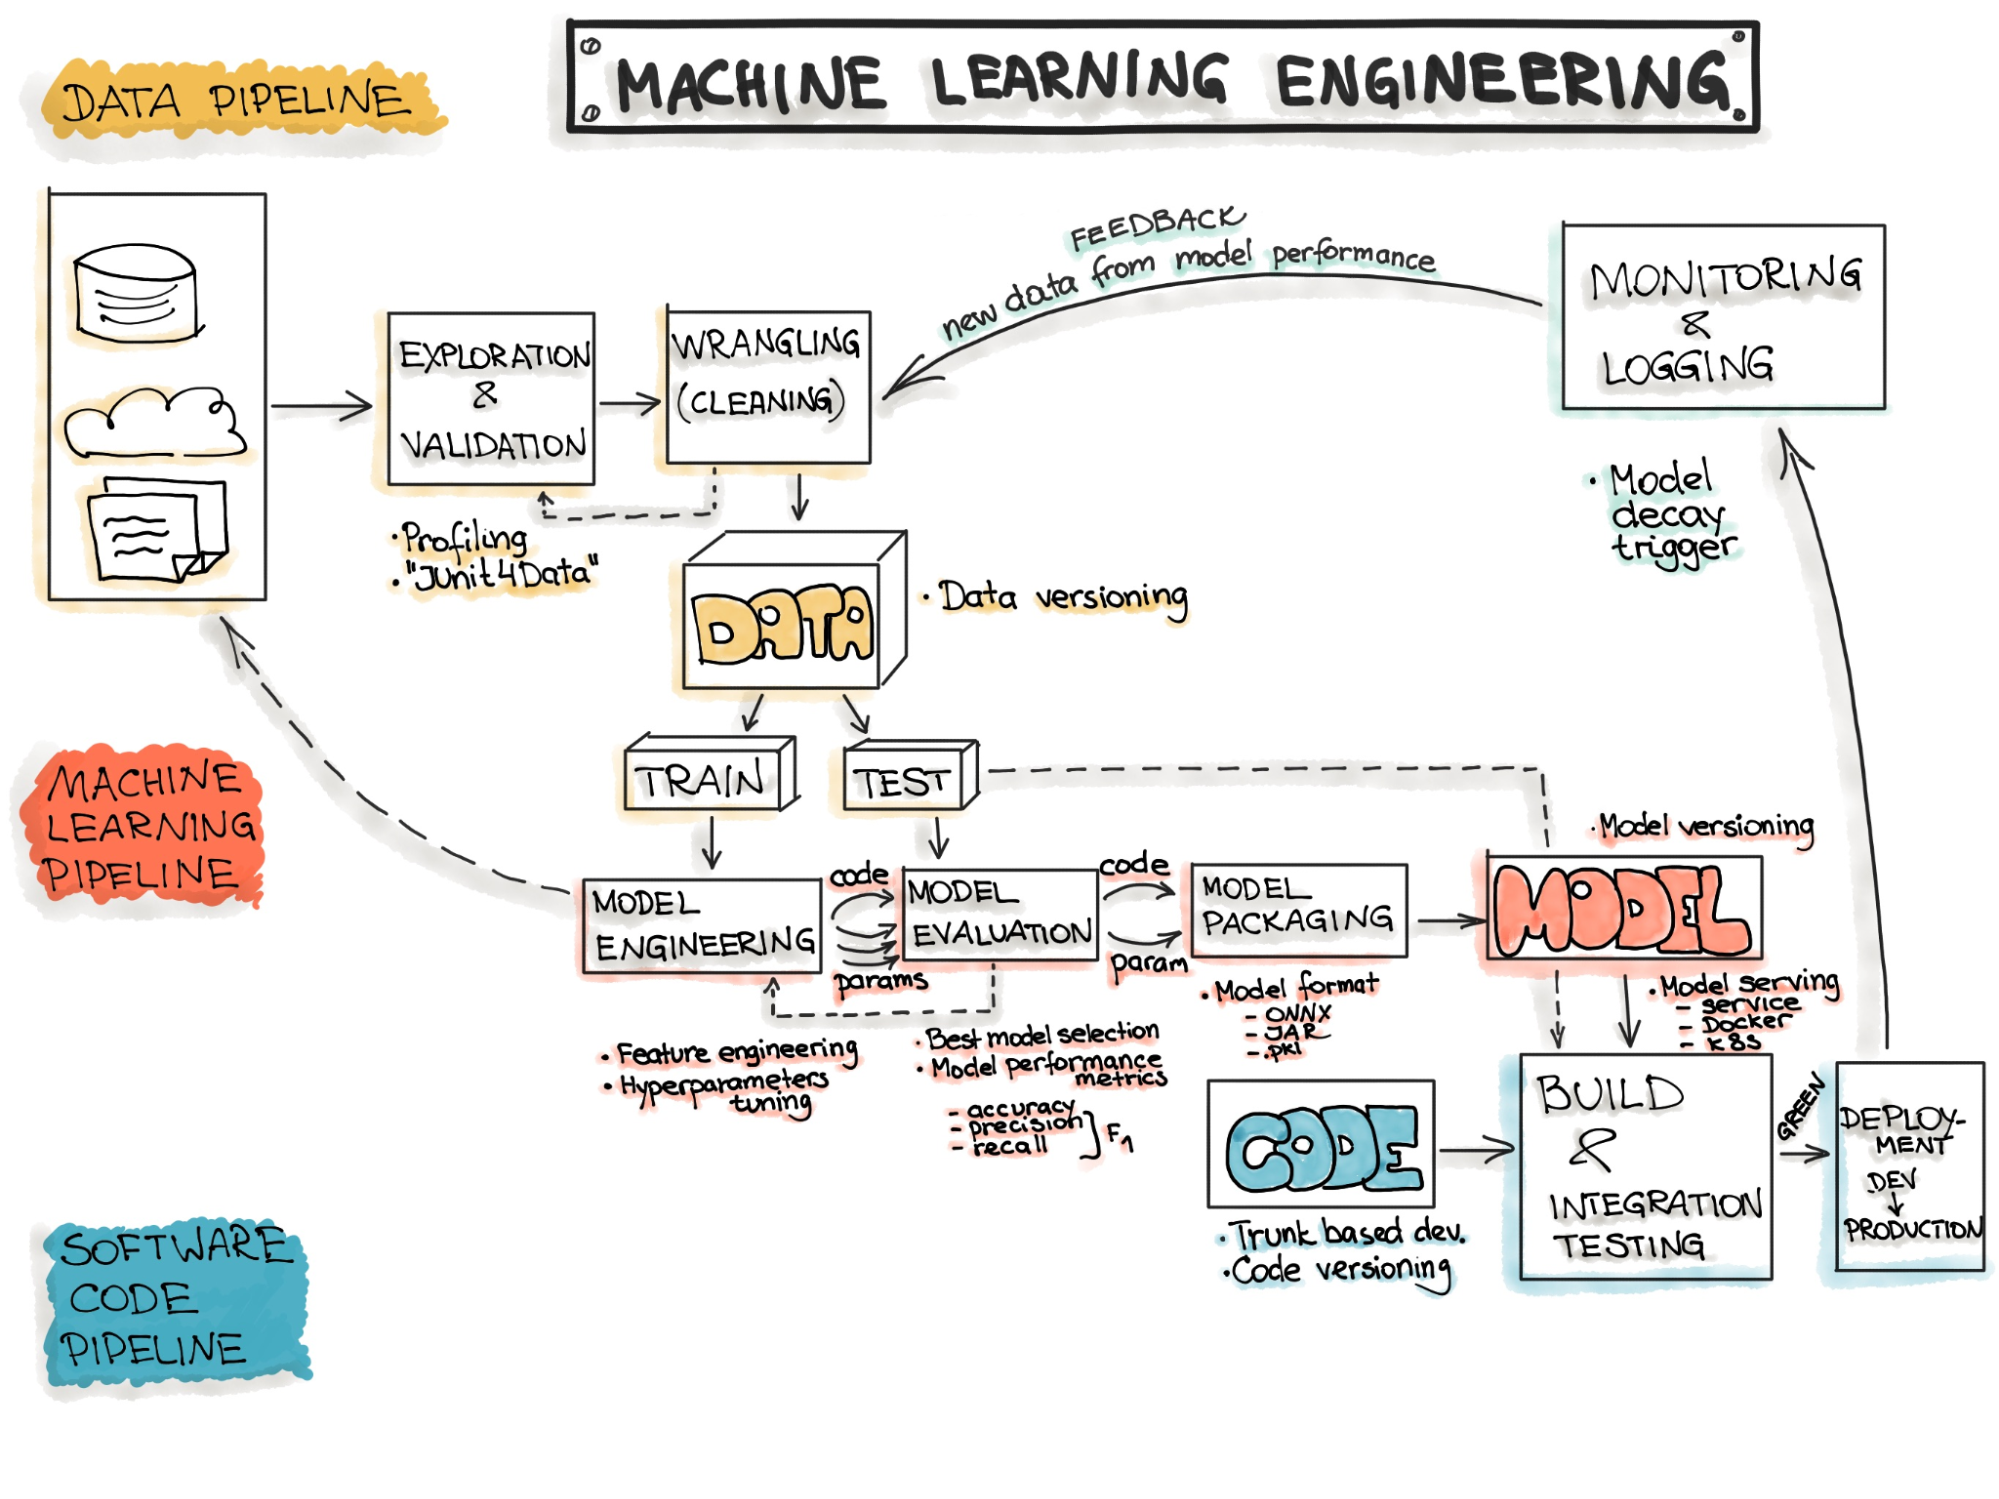
A Machine Learning workflow is not meant to be linear, just like traditional software. It is mainly composed of three distinct layers: data, model, and code, and one will continuously give and retrieve feedback from others.
So while with traditional software, we can say that each step that composes a workflow can be atomic and somehow isolated, in Machine Learning, this is not entirely true as the layers are deeply intertwined.
A typical example is when changes to the data set require retraining or re-thinking a model. A different model also usually needs modifications to the code that runs it.
Let’s see together what every Layer is composed of and how it works.
The Data layer comprises all the tasks needed to manipulate data and make it available for model design and training: data ingestion, data inspection, cleaning, and finally, data preprocessing.
Data for real-world problems can be in the numbers of GB or even TB, continuously increasing, so we need proper storage for handling massive data lakes.
The storage must be robust, allow efficient parallel processing, and integrate easily with tools for ETL jobs.
This layer is the most crucial, representing 80% of the work done in a Machine Learning workflow; two famous quotes state this fact: "garbage in, garbage out" and "your model is only as good as your data.”
Most of these concepts are the prerogative of a Data Analytics practice, deeply entangled with Machine Learning, and we will analyze them in detail later on in this article.
The Model layer contains all the operations to design, experiment, train, and validate one or more Machine Learning models. ML practitioners conduct trials on data in this layer, try algorithms on different hardware solutions, and do Hyperparameters tuning.
This layer is typically subject to frequent changes due to updates on both Data and Code, necessary to avoid concept drift. To properly handle its lifecycle management at scale, we must define automatic procedures for retraining and validation.
The Model layer is also a stage where discussions occur, between data scientists and stakeholders, about model validation, conceptual soundness, and biases on expected results.
In the Code layer, we define a set of procedures to put a model in production, manage inferences requests, store a model's metadata, analyze overall performances, monitor the workflow (debugging, logging, auditing), and orchestrate CI/CD/CT/CM automatisms.
A good Code layer allows for a continuous feedback model, where the model evolves in time, taking into account the results of ongoing inferences.
All these three layers are managed by "sub-pipelines," which add up to each other to form a "macro-pipeline" known as Machine Learning Pipeline.
Automatically designing, building, and running this Pipeline while reducing the deployment gap in the process is the core of the MLOps paradigm.
MLOps aims to make developing and maintaining Machine Learning workflows seamless and efficient. The data science community generally agrees that it is not a single technical solution, yet a series of best practices and guiding principles around Machine Learning.
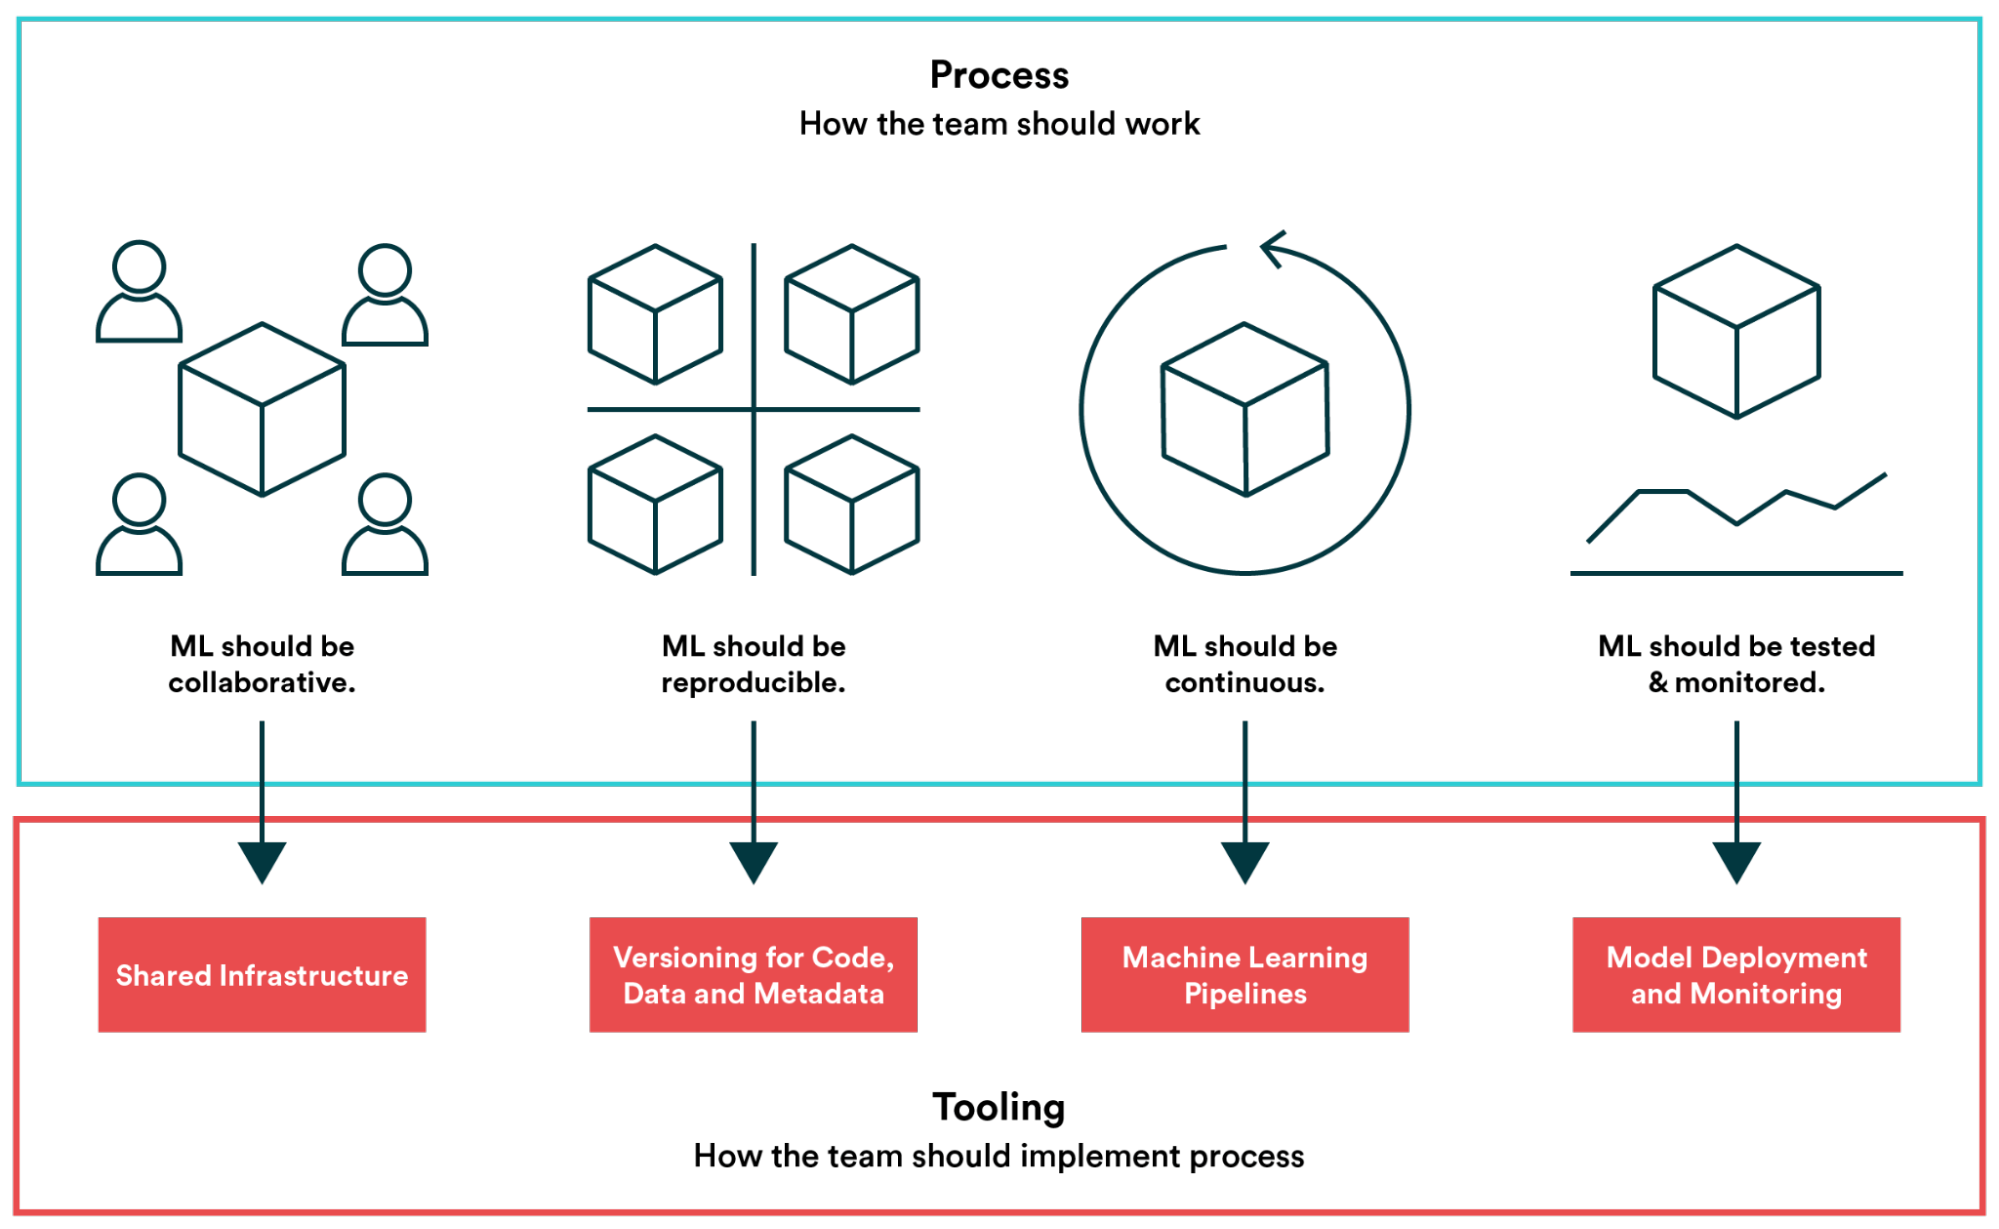
An MLOps approach involves operations, techniques, and tools, which we can group into four main pillars: Collaboration, Reproducibility, Continuity, and Monitoring.
We will now focus on each one, giving multiple practical examples that show how AWS, with many of its services, can be an invaluable tool to develop solutions that adhere to the paradigm’s best practices.
A good Machine Learning workflow should be collaborative, and collaboration occurs on all the ML pipelines.
Starting from Data Layer, we need a shared infrastructure, which means a distributed data lake. AWS offers several different storage solutions for this purpose, like Amazon Redshift, which is best for Data Warehousing, or Amazon FSx for Lustre, perfect as a distributed file system. Still, the most common service used for data lake creation is Amazon S3.
To properly maintain a data lake, we need to regularly ingest data from different sources and manage shared access between collaborators, ensuring data is always up-to-date.
This is not an easy task, and for that, we can take advantage of S3 LakeFormation, a managed service that helps in creating and maintaining a data lake, by working as a wrapper around AWS Glue and Glue Studio, in particular simplifying Glue’s Crawler set-up and maintenance.
S3 LakeFormation can also take care of data and collaborators' permission rules by managing users and roles underneath AWS Glue Catalog. This feature is crucial as collaboration also means maintaining governance over the data lake, avoiding unintended data manipulation by allowing or denying access to specific resources inside a catalog.
For the model layer, data scientists need a tool for collaborative design and coding of Machine Learning models. It must allow multiple users to work on the same experiment, quickly show the results of each collaborator, grant real-time pair programming, and avoid code regressions and merge conflicts as much as possible.
SageMaker is the all-in-one framework of choice for doing Machine Learning on AWS, and Amazon SageMaker Studio is a unique IDE explicitly developed for working with Jupyter Notebooks having collaboration in mind.
SageMaker Studio allows sharing a dedicated EC2 instance between different registered users, in which it is possible to save all the experiments done while developing a Machine Learning model. This instance can host Jupyter Notebooks directly or receive results, attachments, and graphics via API from other Notebook instances.
SageMaker Studio is also directly integrated with SageMaker Experiments and SageMaker Feature Store.
The first one is a set of API that allows data scientists to record and archive a model trial, from tuning to validation, and report the results in the IDE console. The latter is a purpose-built managed store for sharing up-to-date parameters for different model trials.
SageMaker Feature Store represents a considerable step forward in maintaining governance over data parameters across different teams, mainly because it avoids a typical misused pattern of having different sets of parameters for training and inference. It is also a perfect solution to ensure that every data scientist working on a project has complete labeling visibility.
To be robust, fault-tolerant, and scale properly, just like "traditional" software applications, a Machine Learning workflow must be reproducible.
One crucial point we must address with care, as we said before, is Version Control: we must ensure code, data, model metadata, and features are appropriately versioned.
For Jupyter Notebooks, Git or AWS CodeCommit are natural choices, but managing the information of different trials, especially model metadata, requires some considerations.
We can use SageMaker Feature Store for metadata and features. It allows us to store data directly online in a managed store or integrate with AWS Glue (and S3 LakeFomation). It also enables data encryption using AWS KMS and can be controlled via API or inside SageMaker Studio.
When you want a workflow to be reproducible, you also mean experimenting on a larger scale, even in parallel, in a quick, predictable, and automatic way.
SageMaker offers different ways to mix and match different Machine Learning algorithms, and AWS allows for three possible approaches for executing a model.
Managed Algorithm: SageMaker offers up to 13 managed algorithms for common ML scenarios, and for each one, detailed documentation describes software and hardware specifications.
Bring your own algorithm: data scientists can quickly introduce custom logic on notebooks, as long as the model respects SageMaker fit() requirements.
Bring your own Container: particular models such as DBScan require custom Kernels for running the algorithm, so SageMaker allows registering a custom container with the special Kernel and the code for running the model.
Data Scientists can tackle all these approaches together.
SageMaker gives the possibility to define the hardware on which running a model training or validation by selecting the Instance Type and the Instance Size in the model properties, which is extremely important as different algorithms require CPU or GPU optimized machines.
To fine-tune a model, SageMaker can run different Hyperparameter Tuning Strategies: Random Search and Bayesian Search. These two strategies are entirely automatic, granting a way to test a more significant number of trial combinations in a fraction of time.
To enhancing the repeatability of experiments, we also need to manage different ways of doing data preprocessing (different data sets applied to the same model). For this, we have AWS Data Wrangler, which contains over 300 built-in data transformations to quickly normalize, transform, and combine features without having to write any code.
AWS Data Wrangler can be a good choice when the ML problem you’re addressing is somehow standardized, but for most cases, the datasets are extremely diverse, which means tackling ETL jobs on your own.
For custom ETL jobs, AWS Glue is still the way to go, as it also allows saving Job Crawlers and Glue Catalogs (for repeatability). Along with AWS Glue and AWS Glue Studio, we have also tried AWS Glue Elastic Views, a new service to help to manage different data sources together.
To make our Machine Learning workflow continuous, we must use pipeline automation as much as possible to manage its entire lifecycle.
We can break the entire ML workflow into three significant pipelines, one for each Machine Learning Layer.
The Data pipeline is composed of Ingestion, Exploration, Validation, Cleaning, and Splitting phases.
The Ingestion phase on AWS typically means bringing raw data to S3, using any available tool and technology: direct-API access, custom Lambda crawlers, S3 LakeFormation, or Amazon Kinesis Firehose.
Then we have a preprocessing ETL phase, which is always required!
AWS Glue is the most versatile among all the available tools for ETL, as it allows reading and aggregating information from all the previous services by using Glue Crawlers. These routines can poll from different data sources for new data.
We can manage Exploration, Validation, and Cleaning steps by creating custom scripts in a language of choice (e.g., Python) or using Jupyter Notebook, both orchestrated via AWS Step Functions.
AWS Data Wrangler represents another viable solution, as it can automatically take care of all the steps and connect directly to Amazon SageMaker Pipelines.
The Model pipeline consists of Training, Evaluation, Testing, and Packaging phases.
These phases can be managed directly from Jupyter Notebook files and integrated into a pipeline using AWS StepFunctions SageMaker SDK, which allows calling SageMaker functions inside a StepFunction script.
This exploit gives extreme flexibility as it allows to:
Having the logic of this Pipeline on Jupyter Notebooks has the added benefit of having everything versioned and easily testable.
Packaging can be managed through Elastic Container Registry APIs, directly from a Jupyter Notebook or an external script.
The Deployment Pipeline runs the CI/CD part and is responsible for taking models online during the Training, Testing, and Production phases. A key aspect during this Pipeline is that the demand for computational resources is different for all three stages and changes over time.
For example, training will require more resources than testing and production at first, but later on, as the demand for inferences will grow, production requirements will be higher (Dynamic Deployment).
We can apply Advanced deployment strategies typical of "traditional" software development to tackle ML workflows, including A/B testing, canary deployments, and blue/green deployments.
Every aspect of deployment can benefit from Infrastructure as Code techniques and a combination of AWS services like AWS CodePipeline, CloudFormation, and AWS StepFunctions.
Finally, good Machine Learning workflows must be monitorable, and monitoring occurs at various stages.
We have performance monitoring, which allows understanding how a model behaves in time. By continuously having feedback based on new inferences, we can avoid model aging (overfitting) and concept drift.
SageMaker Model Monitor helps during this phase as it can do real-time monitoring, detecting biases and divergences using Anomaly Detection techniques, and sending alerts to apply immediate remediation.
When a model starts performing lower than the predefined threshold, our pipeline will begin a retraining process with an augmented data set, consisting of new information from predictions, different Hyperparameters combinations, or applying re-labeling on the data set features.
SageMaker Clarify is another service that we can exploit in the monitoring process. It detects potential bias during data preparation, model training, and production for selected critical features in the data set.
For example, it can check for bias related to age in the initial dataset or in a trained model and generates detailed reports that quantify different types of possible bias. SageMaker Clarify also includes feature importance graphs for explaining model predictions.
Debugging a Machine Learning model, as we can see, is a long, complex, and costly process! There is another useful AWS service: SageMaker Debugger; it captures training metrics in real-time, such as data loss during regression, and sends alerts when anomalies are detected.
SageMaker Debugger is great for immediately rectifying wrong model predictions.
Logging on AWS can be managed on the totality of the Pipeline using Amazon CloudWatch, which is available with all the services presented. Cloudwatch can be further enhanced using Kibana through ElasticSearch to have an easy way to explore log data.
We can also use CloudWatch to trigger automatic rollback procedures in case of alarms on some key metrics. Rollback is also triggered by failed deployments.
Finally, the reproducibility, continuity, and monitoring of an ML workload enables the cost/performance fine-tuning process, which happens cyclically across all the workload lifecycle.
In this article, we’ve dived into the characteristics of the MLOps paradigm, showing how it took concepts and practices from its DevOps counterpart to allow Machine Learning to scale up to real-world problems and solve the so-called deployment gap.
We’ve shown that, while traditional software workloads have more linear lifecycles, Machine Learning problems are based on three macro-areas: Data, Model, and Code which are deeply interconnected and provide continuous feedback to each other.
We’ve seen how to tackle these particular workflows and how MLOps can manage some unique aspects like complexities in managing model’s code in Jupyter Notebooks, exploring datasets efficiently with correct ETL jobs, and providing fast and flexible feedback loops based on production metrics.
Models are the second most crucial thing after data. We’ve learned some strategies to avoid concept drift and model aging in time, such as Continuous Training, which requires a proper monitoring solution to provide quality metrics over inferences and an adequate pipeline to invoke new model analysis.
AWS provides some managed services to help with model training and pipelines in general, like SageMaker AutoPilot and SageMaker Pipelines.
We have also seen that AWS allows for multiple ways of creating and deploying models for inference, such as using pre-constructed models or bringing your container with custom code and algorithms. All images are saved and retrieved from Elastic Container Registry.
We’ve talked about how collaboration is critical due to the experimental nature of Machine Learning problems and how AWS helps by providing an all-in-one managed IDE called SageMaker Studio.
We have features like SageMaker Experiments for managing multiple experiments, SageMaker Feature Store for efficiently collecting and transforming data labels, or SageMaker Model Monitoring and SageMaker Debugger for checking model correctness and find eventual bugs.
We’ve also discussed techniques to make our Machine Learning infrastructure solid, repeatable, and flexible, easy to scale on-demand based on requirements evolving in time.
Such methods involve using AWS Cloudformation templates to take advantage of Infrastructure as Code for repeatability, AWS Step Functions for structuring a state-machine to manage all the macro-areas, and tools like AWS CodeBuild, CodeDeploy, and CodePipeline to design proper CI/CD flows.
We hope you’ve enjoyed your time reading this article and hopefully learned a few tricks to manage your Machine Learning workflows better.
As said before, if Machine Learning is your thing, we encourage again having a look at our articles with use-cases and analysis on what AWS offers to tackle ML problems here on Proud2beCloud!
As always, feel free to comment in the section below, and reach us for any doubt, question or idea! See you on #Proud2beCloud in a couple of weeks for another exciting story!