
How to Use Amazon Bedrock to Deploy Foundation Models in Production (Complete Guide)
22 April 2026 - 7 min. read
Damiano Giorgi
DevOps Engineer

"Imagination is more important than knowledge. Knowledge is limited. Imagination encircles the world". Albert Einstein
User experience is critical for a website's success: if a user experiences errors while using a service, it will impact the conversion rate and income.
Correlating data to find the root cause of an issue is a time-consuming process: It takes a lot of work to search the enormous amount of logs to identify what the user was doing and its journey. Sometimes, it's also impossible to identify small glitches that worsen the user journey through our website.
Let's assume that once the user logs into a website and starts a transaction, it is assigned a unique ID (a shopping cart identification, an order ID, or a session cookie).
If an error occurs and the user contacts us to solve it, we can indeed identify the issue. However, we need to manually correlate data from the error to the identifier used by our application. Then, we might know what the user was doing and find the cause of the problem.
This kind of approach is reactive. What if we could switch the paradigm to proactively leverage the data and tools we already have to see which transactions have issues? Can we reach out easily and quickly to help the user before he opens a ticket?
We have already seen monitoring solutions on AWS: AWS X-Ray, Amazon CloudWatch, and CloudWatch RUM, as well as how to extract meaningful data for our business intelligence. However, correlating live data to respond quickly to events and errors requires a deeper integration.
In this article, we'll see how we can use a less-known CloudWatch feature (CloudWatch Custom Widgets) to gain better and faster insights about our users without using additional services. We already have the data we need; we only have to unleash our imagination :)
First things first: there's an X-Ray integration with RUM: it's a simple checkbox, and it will start tracing and correlating errors with lambdas, API calls, and AWS Services; here is an example from an actual use case:
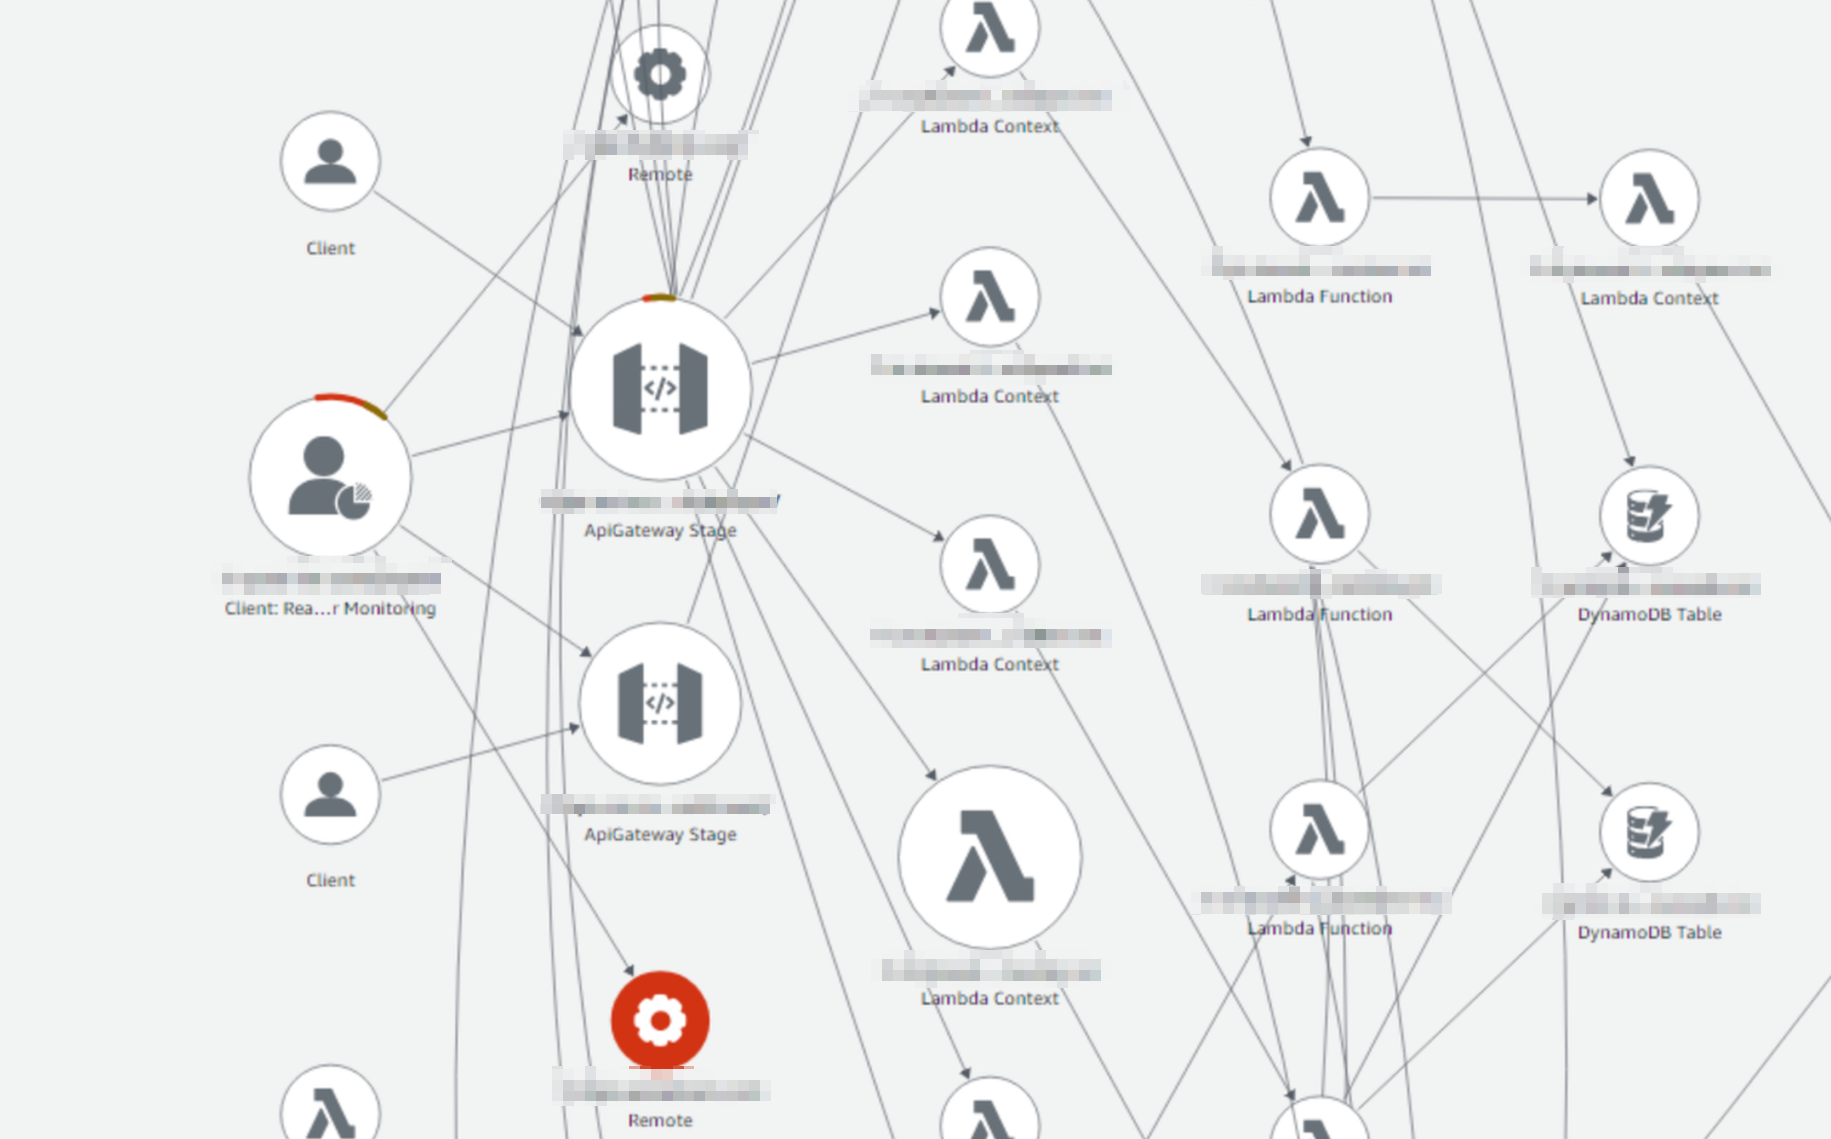
As you can see, with serverless architectures, complexity grows, and tracing requires skills and patience.
X-Ray adds a tracing header to ease the correlation between user requests and every component.
While this can be useful for a developer, it is difficult to use for different teams, such as support and data analysis. It also doesn't have information about the application domain knowledge required to decide how to modify the application behavior. Can we have a link between an application error and application data?
For sure! Meet CloudWatch Custom Widgets.
Custom Widgets help search and visualize data conveniently by relying on Lambda Functions, adding a helpful computation layer that can automate the human error-prone job of correlating data available in different places.
Let's see how we have a dashboard that visualizes transactions with errors, searching and extracting meaningful data.
We will assume that X-ray traces already contain the transaction ID for convenience. We now have to find a way to get all the errors and display details about the transactions, extracting other meaningful information from our data sources.
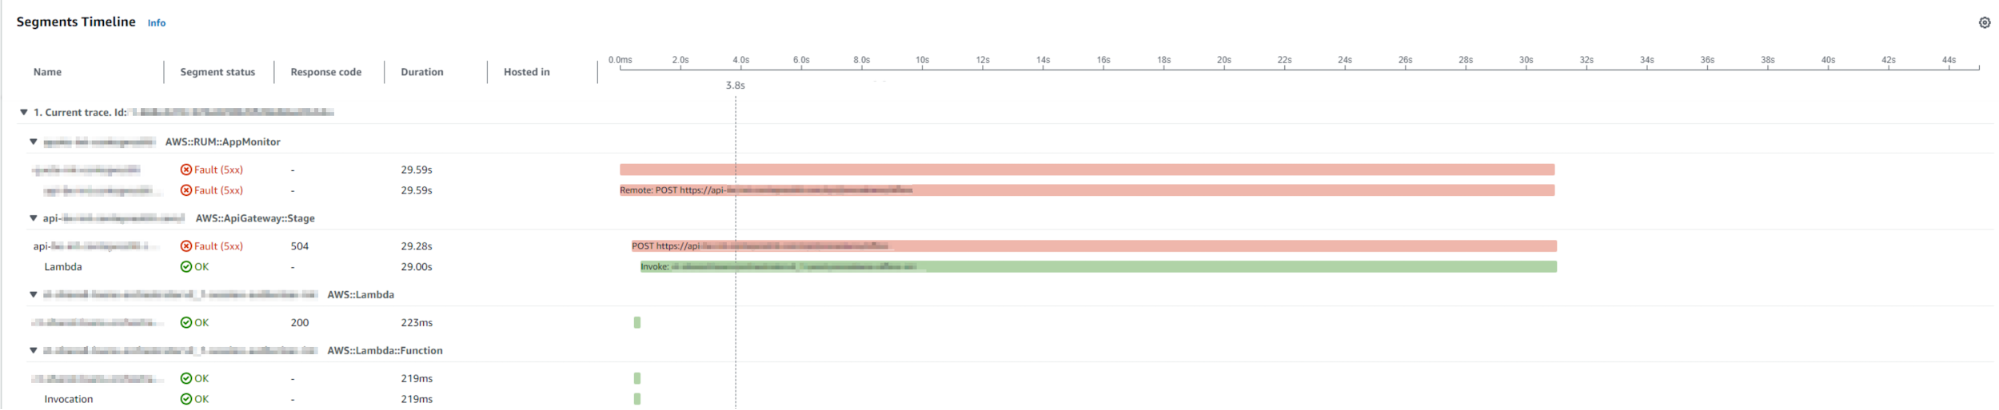
Lucky for us, we can search X-Ray traces for errors recorded by RUM that happened in user's browsers with a syntax similar to this:
fault AND (service(id(type: "client::RUM" )))With this simple query, we can have all the traces. Finding the transaction ID is only a matter of searching the records returned by our query in a lambda function using your preferred programming language with the AWS SDK libraries (i.e., python and boto3).
The same lambda can search for other information in databases, so we can retrieve information about the user ID, email, or other details to help solve the issue.
We can simply output HTML code from our lambda function to visualize all this information in a CloudWatch Dashboard. You can find samples here.
Once the lambda is ready, you can add a custom widget to a dashboard and have a preview of the output:
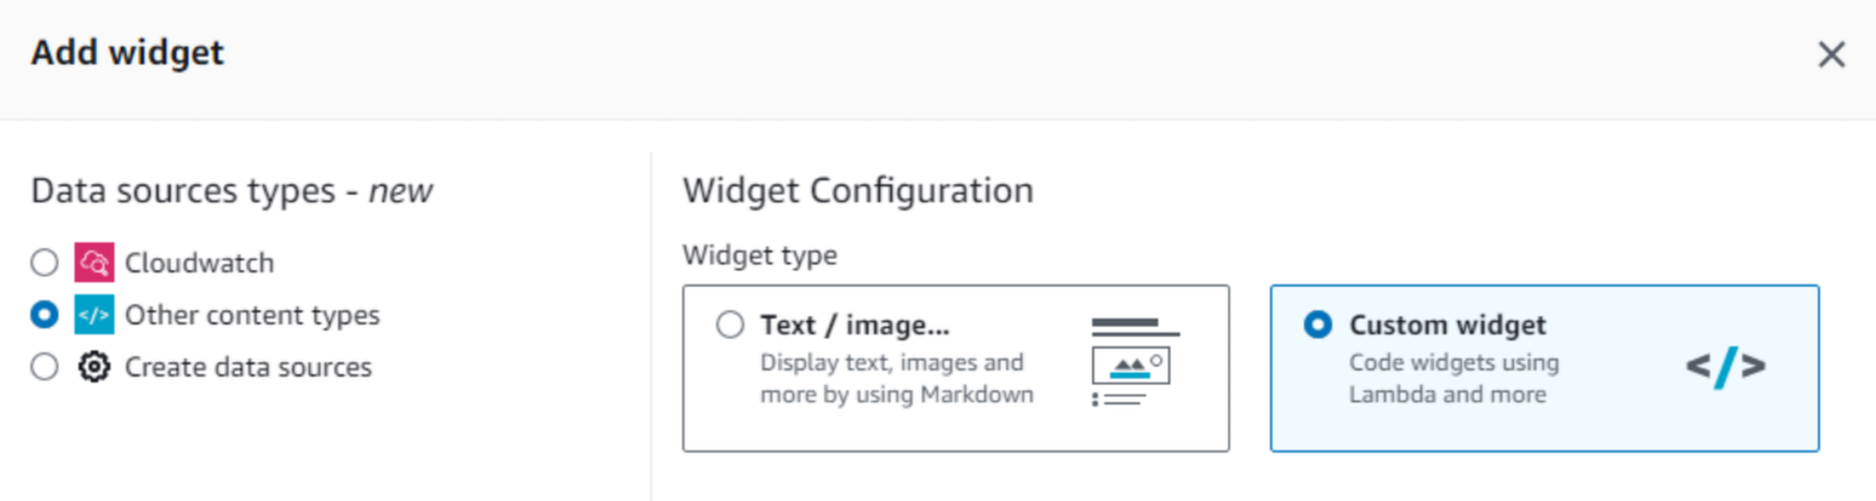
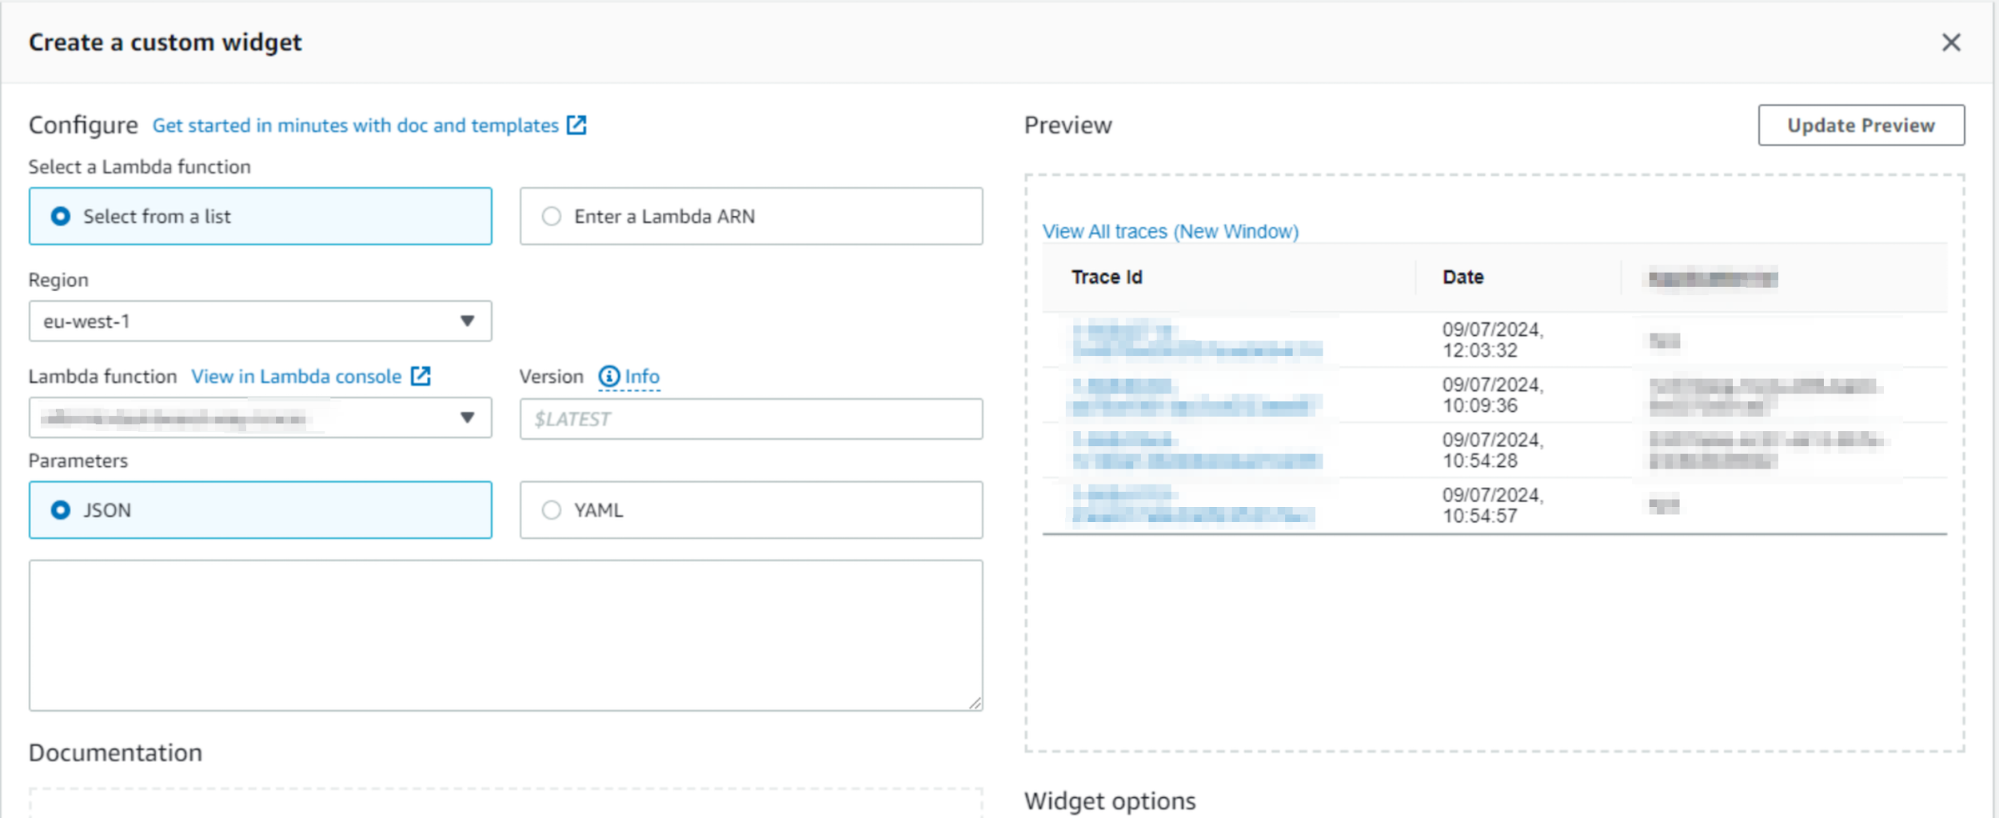
As you can see, we can have all the errors available in a simple visualization for a support team that can involve developers when needed and have information ready to help users who experience problems.
Our use case described above is simple and technical, but you can expand this example with all the necessary information; think about the added value of having statistics on how frequently an error occurs in a specific user journey.
Once you find a way to correlate data, your imagination is the only limit!
I find this kind of approach similar to concepts of the Unix philosophy, where you can build complex workflows using only combinations of simple command line utilities:
Have you struggled in the past to correlate data and prepare it for non-technical teams to gain insights? What solution did you find? Let us know in the comments!
Proud2beCloud is a blog by beSharp, an Italian APN Premier Consulting Partner expert in designing, implementing, and managing complex Cloud infrastructures and advanced services on AWS. Before being writers, we are Cloud Experts working daily with AWS services since 2007. We are hungry readers, innovative builders, and gem-seekers. On Proud2beCloud, we regularly share our best AWS pro tips, configuration insights, in-depth news, tips&tricks, how-tos, and many other resources. Take part in the discussion!