
Enabling enterprise Telemetry on AWS: Handling massive data backfills using ECS and Databricks wi...
17 June 2026 - 1 min. read
Keidi Xhafa

Working with microservices has many advantages, but it also has some flaws. One of them undoubtedly is debugging and logging the whole application.
Every microservice may produce logs in a different place, and jumping from one to another while debugging could be time-consuming.
Moreover, knowing what microservices are part of an application and finding bottlenecks or points of failure can be tricky, especially with massive and poorly documented applications.
X-Ray solves both problems, providing a centralized point to access your application logs and consult a map representing your microservices, resources, and how they communicate.
X-Ray is a service that allows you to gather data from applications you want to monitor so that you can analyze them to find possible issues or ways to improve your application performance. Sending trace data for incoming and outbound requests and other events lets you see which AWS resources, microservices, and web APIs are used.
This process is called “Instrumentation”.
There are different types of instrumentations:
Many AWS services provide X-Ray integration, such as AWS Lambda, Amazon API Gateway, Amazon Simple Notification Service, or Amazon Simple Queue Service.
AWS services integration with X-Ray can be split into:
The data sent by your application services are called segments. Segments contain different information based on the nature of the request. For instance, an HTTP request will contain information such as the URL, the method, and the response code.
A segment can be split into subsegments to provide more information about all the actors involved in the work. The segment of your application can be split into different subsegments for each function it runs to know the functions' order and duration. Subsegments are also used by X-Ray to create “inferred segments” for services that don’t support X-Ray, such as DynamoDB. This allows X-Ray to show them in the trace map. The trace map shows all the services involved and can be used to analyze the application workflow. The trace map is built using traces. A trace is a collection of all segments generated by a single request to your application.
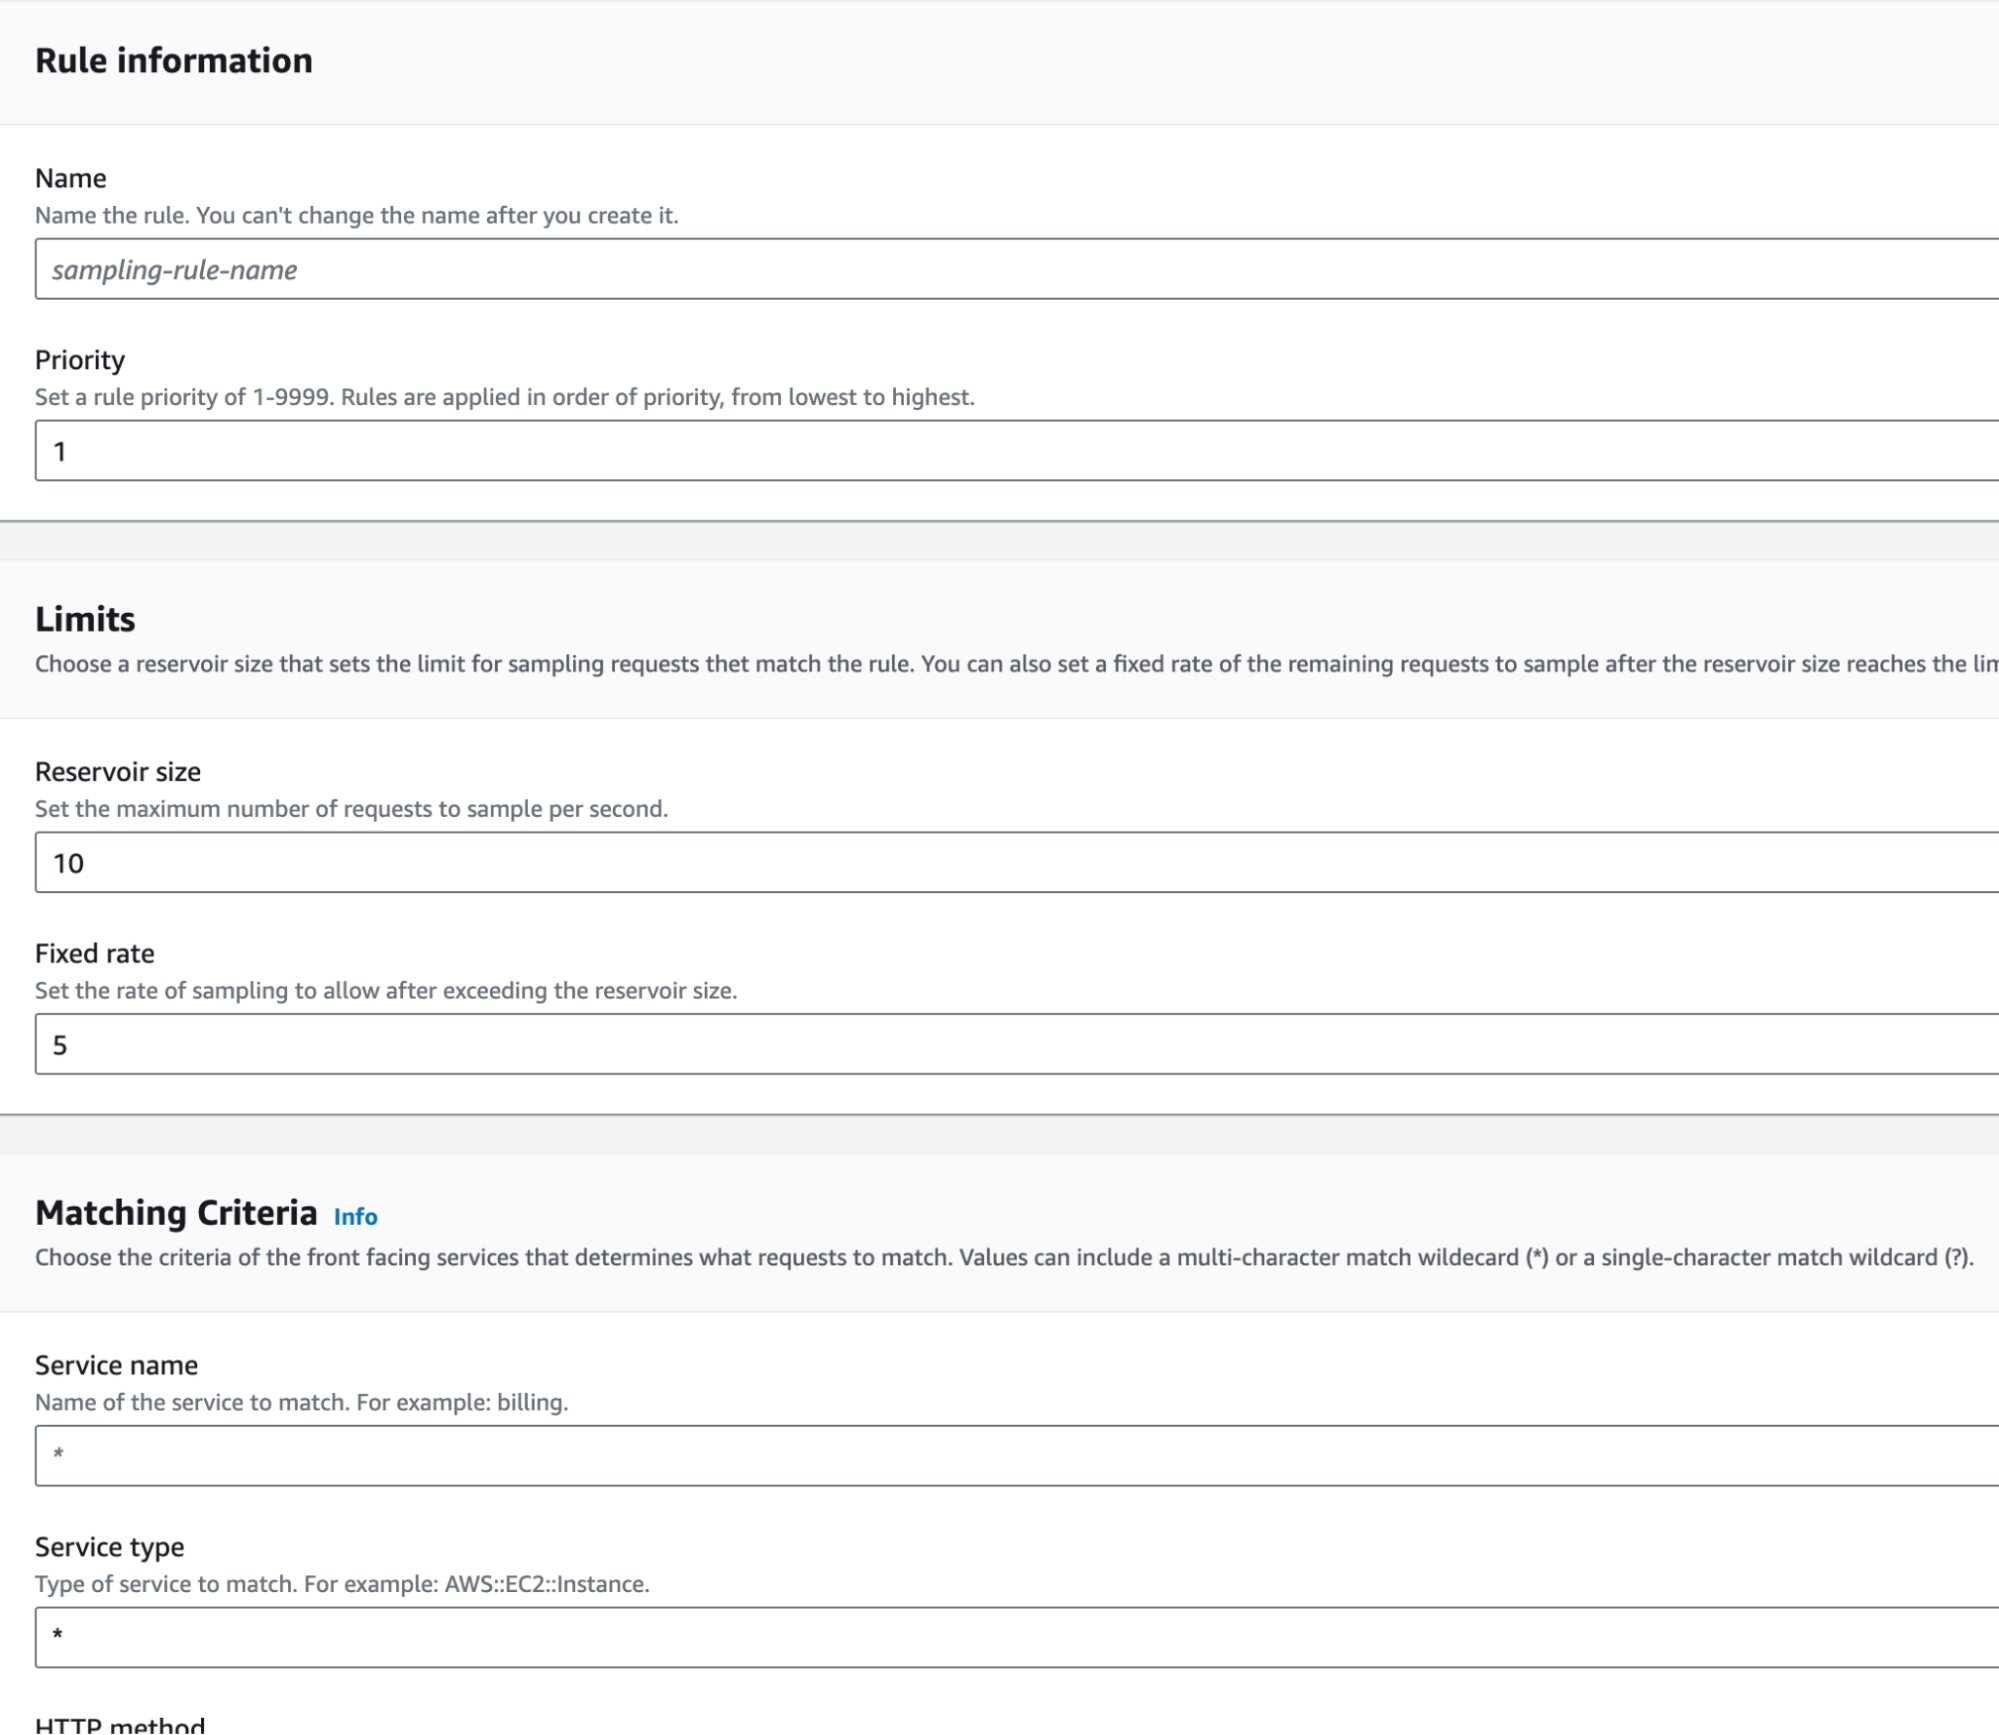
X-Ray does not trace every request, but it follows a sample rate. The sample rate can be customized in the X-Ray settings by creating rules to apply to specific front-facing services.
If your application generates many traces, you can filter them for a more accurate insight using filter expressions. Filter expressions allow you to filter information like traces that generated errors in specific services, traces that originated from certain URLs, or traces whose duration exceeded a certain amount of time.
You can also extend filtering by creating a group. Groups will contain all traces whose respect the filter expression generated after the creation of the group. In groups, you can activate insights and insight notifications. X-Ray identifies emergent issues in your applications and creates insights when ranges are exceeded. If notifications are enabled, you receive a notification for every insight event.
X-Ray tracks errors that occur in your application and errors that are returned by downstream services. Errors are grouped as follows:
X-Ray encrypts traces and data at rest with an AWS-managed encryption key. If you want to turn off encryption or use a key managed by yourself because of compliance requirements, you can configure X-Ray to use a KMS key.
You pay based on the number of traces recorded, retrieved, and scanned.
X-Ray provides a minimum guaranteed trace size of 100KB.
Trace data is retained for 30 days from when it is recorded at no additional cost.
X-Ray has a free tier:
You can customize the sample rate to choose the right compromise between costs and the quantity of data to gather.
We created a simple example application to show you the setup of X-Ray instrumentation and its outputs.
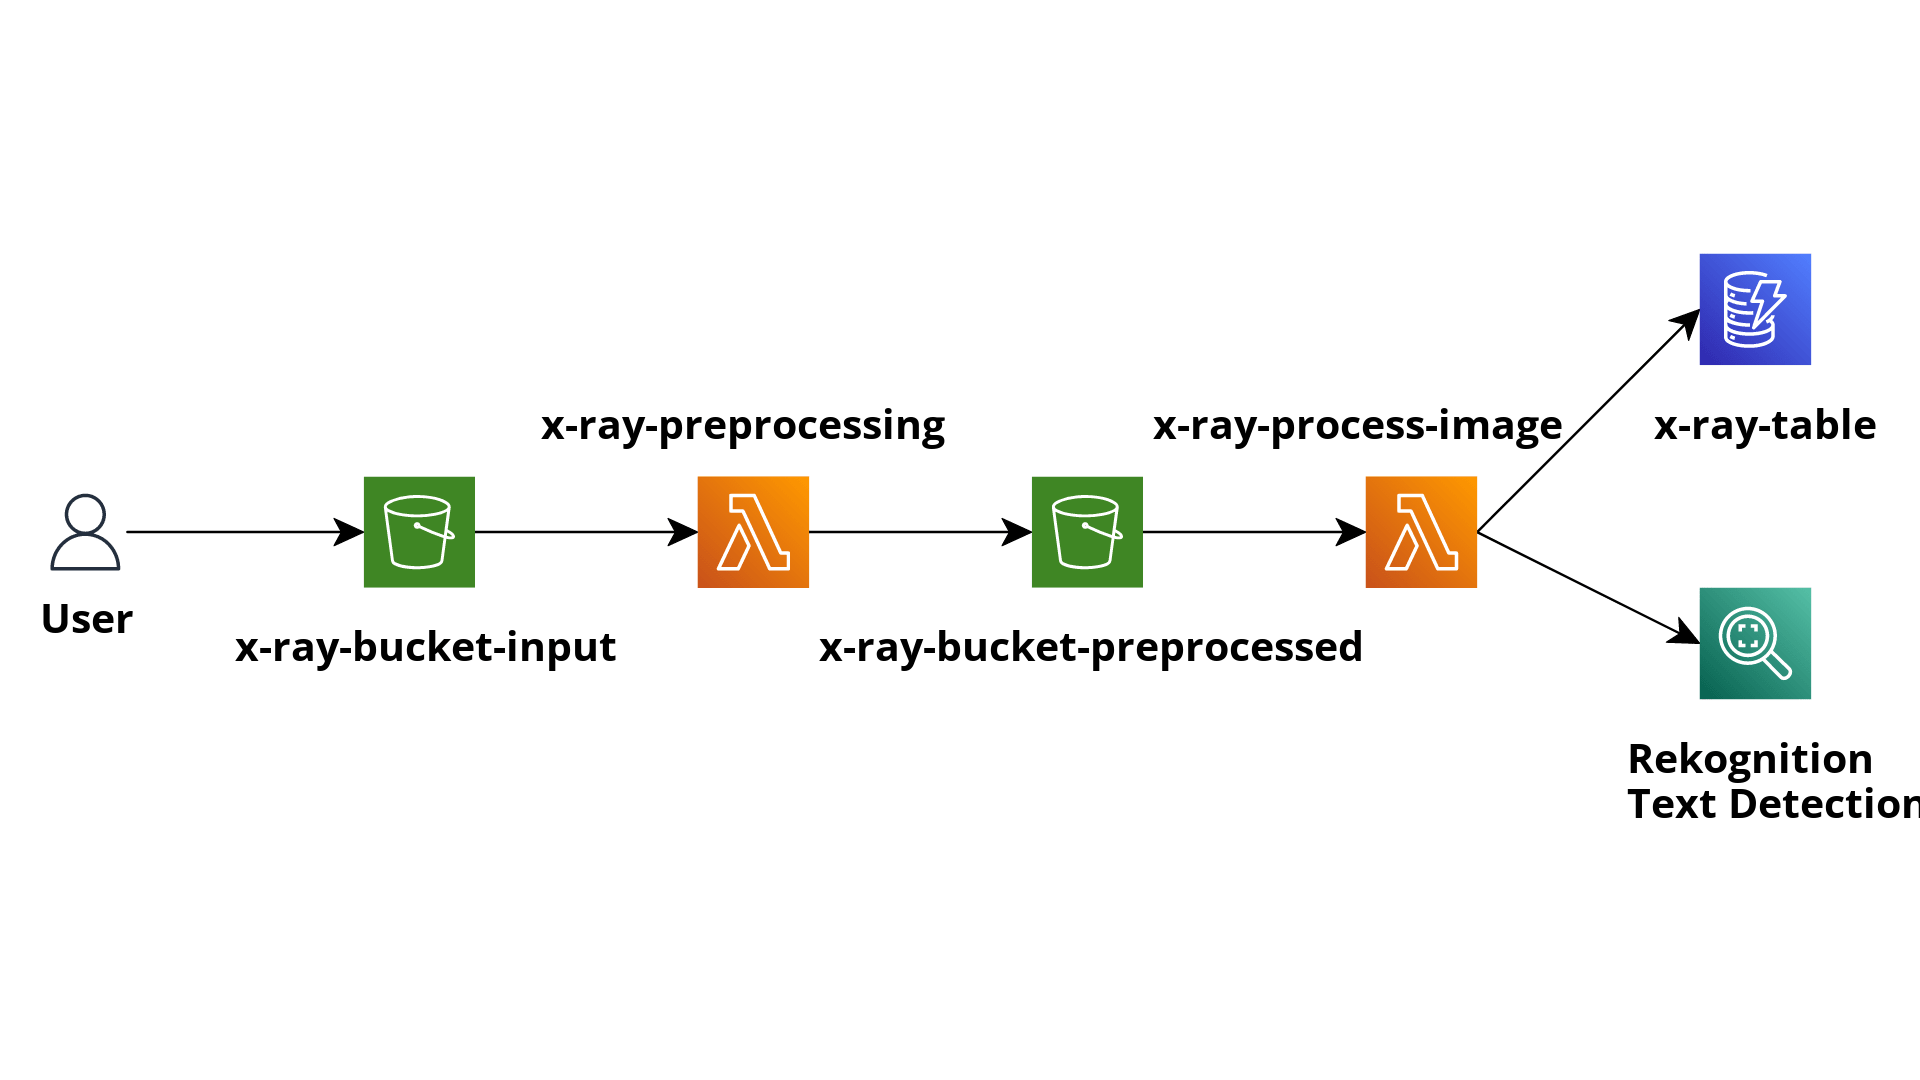
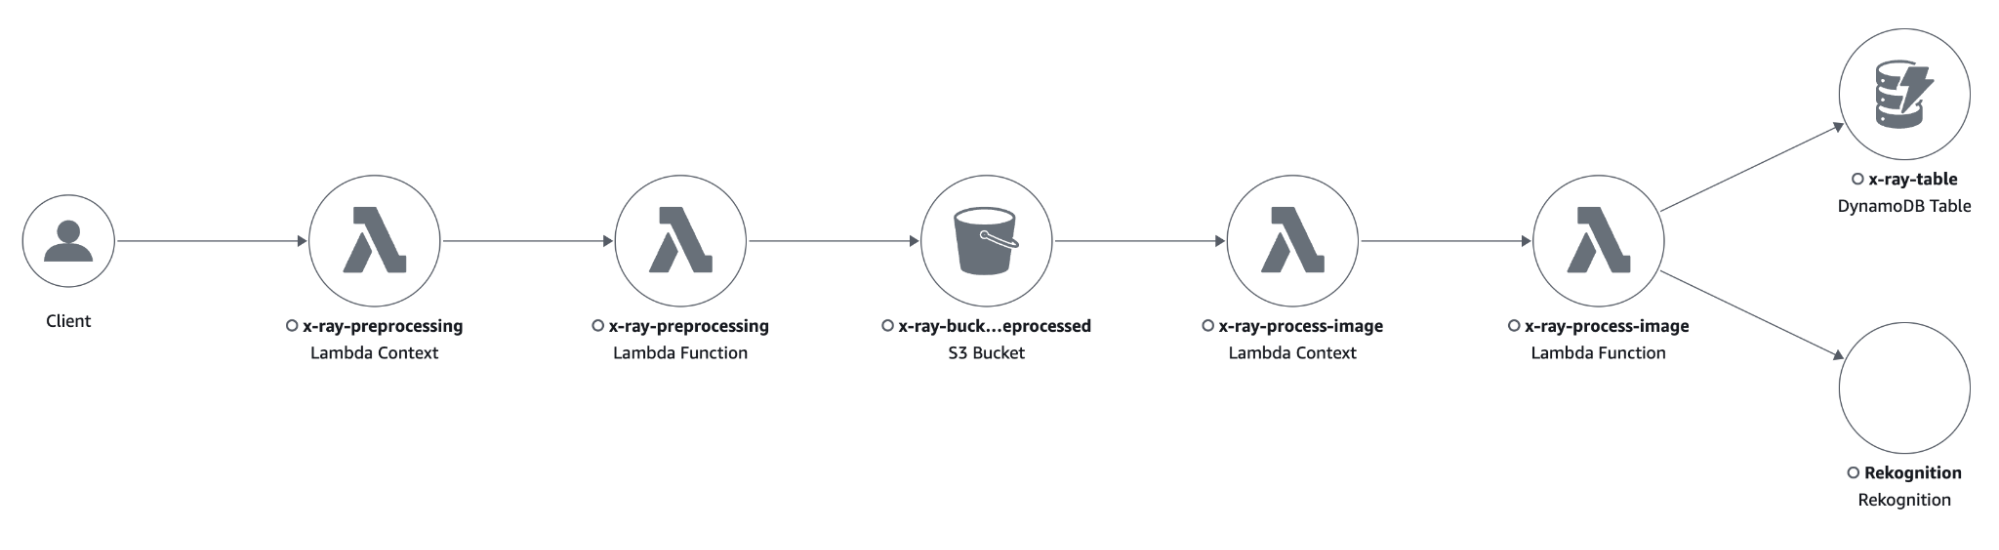
The purpose of the application consists of pre-processing images, sending them to Rekognition to detect text inside of them, and saving the output to a DynamoDB table for later analysis of the results.
The application comprises an S3 bucket where we upload the images we want to analyze.
The creation of objects inside the bucket triggers a Lambda function, which is in charge of applying some pre-processing transformations to the image.
The output of the pre-processing Lambda function will be saved in another S3 bucket, which will trigger another Lambda function to send the image to Rekognition and save the results of the “Text Detection” functionality into a DynamoDB table.
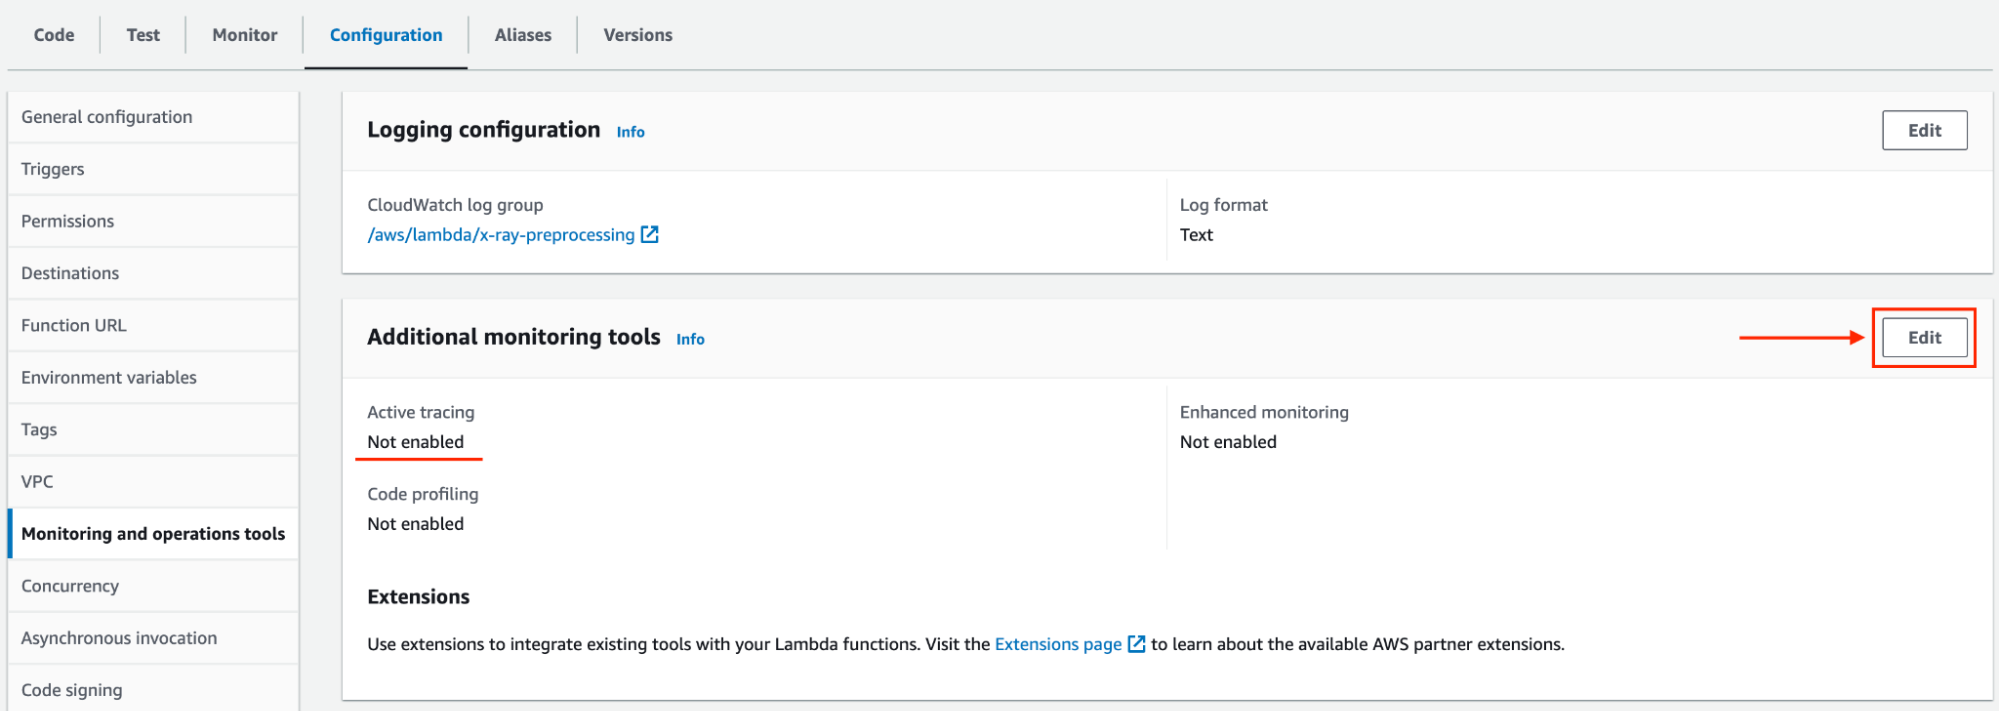
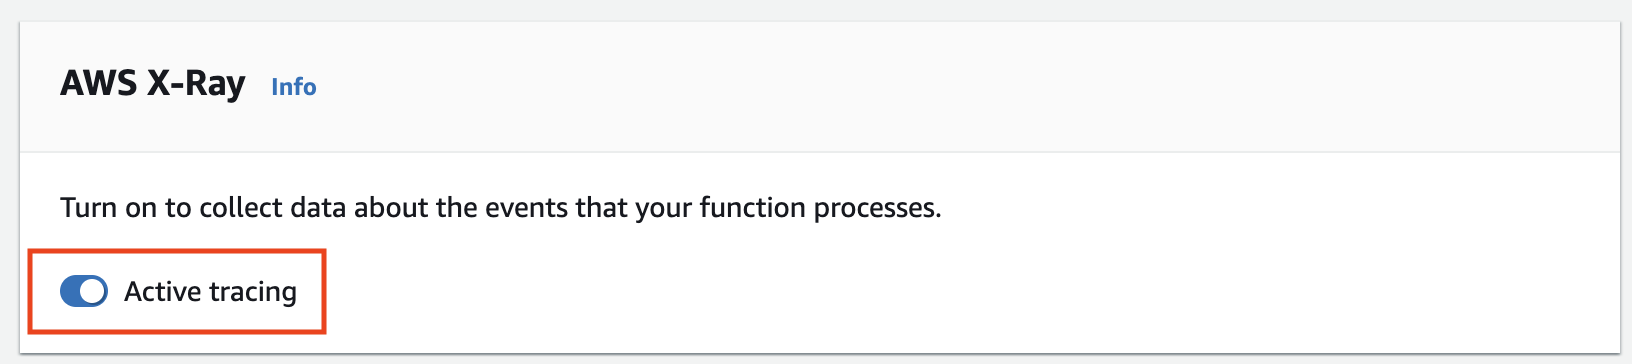
First, to gather data from our application, we must activate tracing in its Lambda functions.
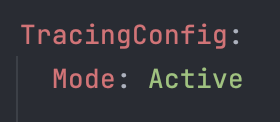
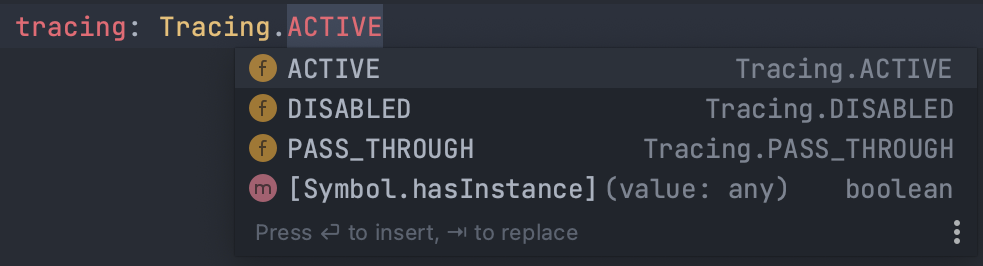
It can be done:
aws lambda update-function-configuration --function-name my-function --tracing-config Mode=Active
Now that the Lambda function’s tracing is enabled, we must configure X-Ray in our code.
One way of doing so is by manual instrumentation, thanks to the X-Ray SDK.
Our Lambda functions run on Node.js and use SDK v3. With the AWS SDK v2, you can activate the capture of all outgoing requests made by the library. Since the AWS SDK V3 has a modular structure, you need to capture each client the application uses. By doing so, every time the clients send a command, a subsegment will be extracted from the Lambda invocation segment, giving us a more precise insight into what happened while executing that command and how much time it required to complete.
You can do the same thing with functions and methods inside your code to know how much every invocation lasted compared to the total duration of the Lambda function execution.
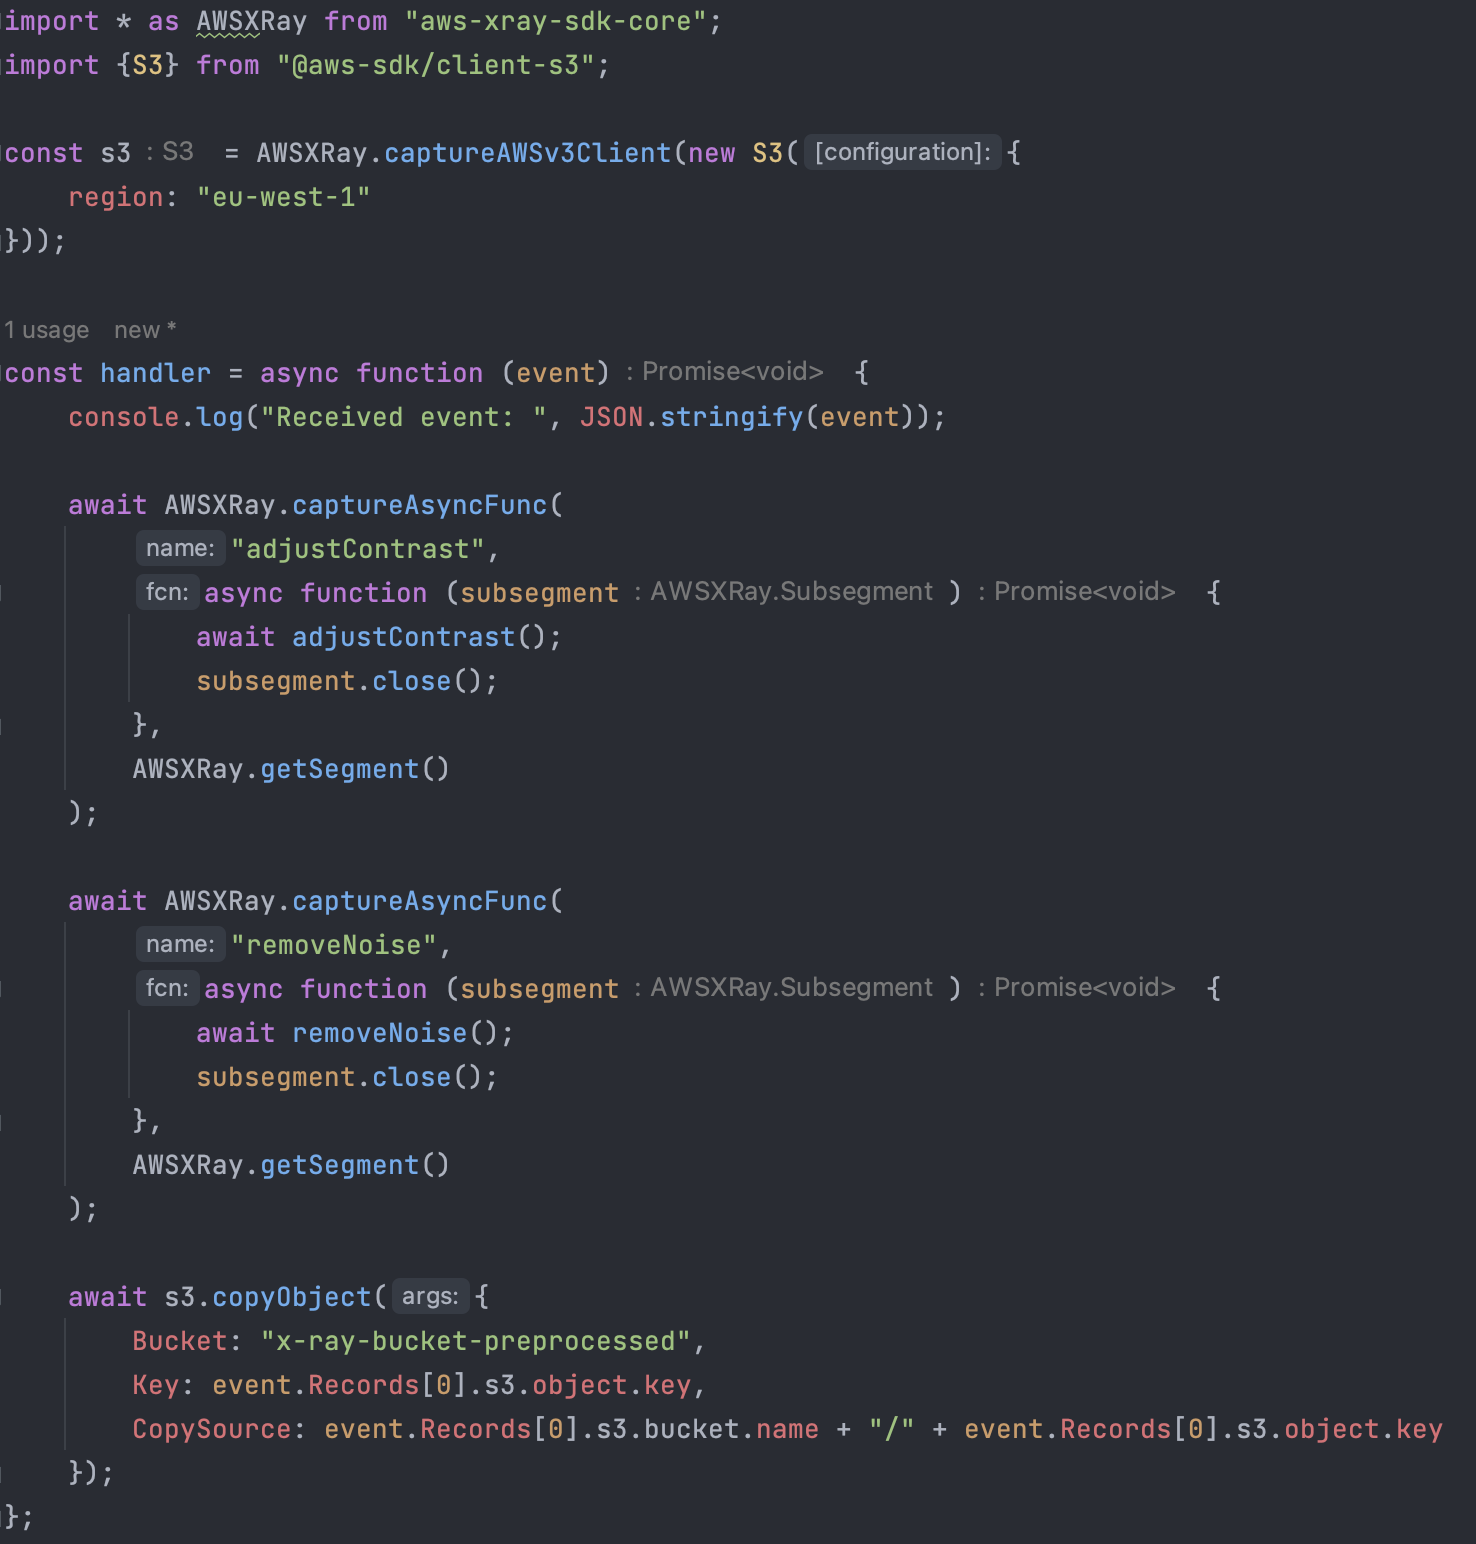
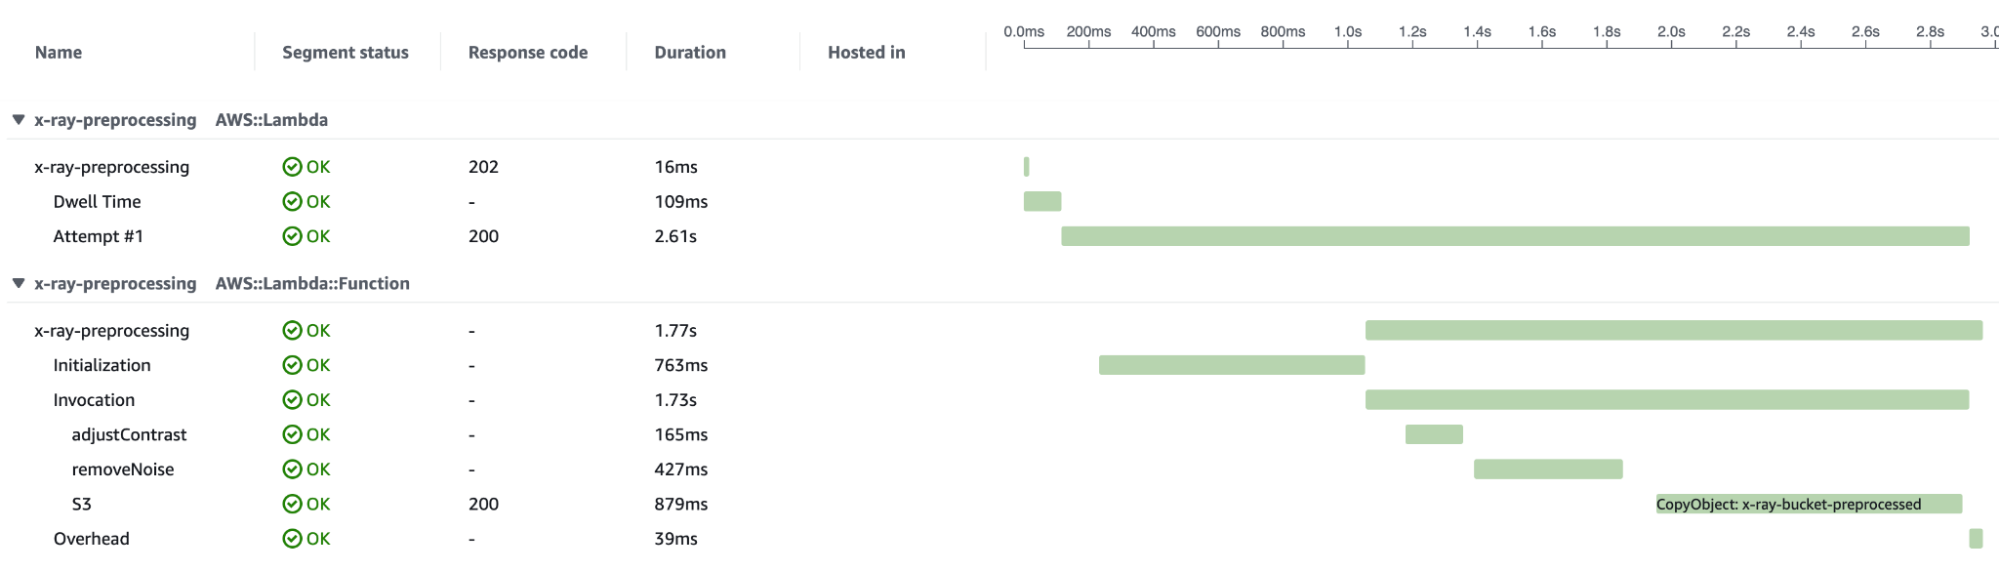
In the case of our pre-processing Lambda Function, we expect the invocation segment to be split into three subsegments:
In the following there is the result of one invocation of the function:
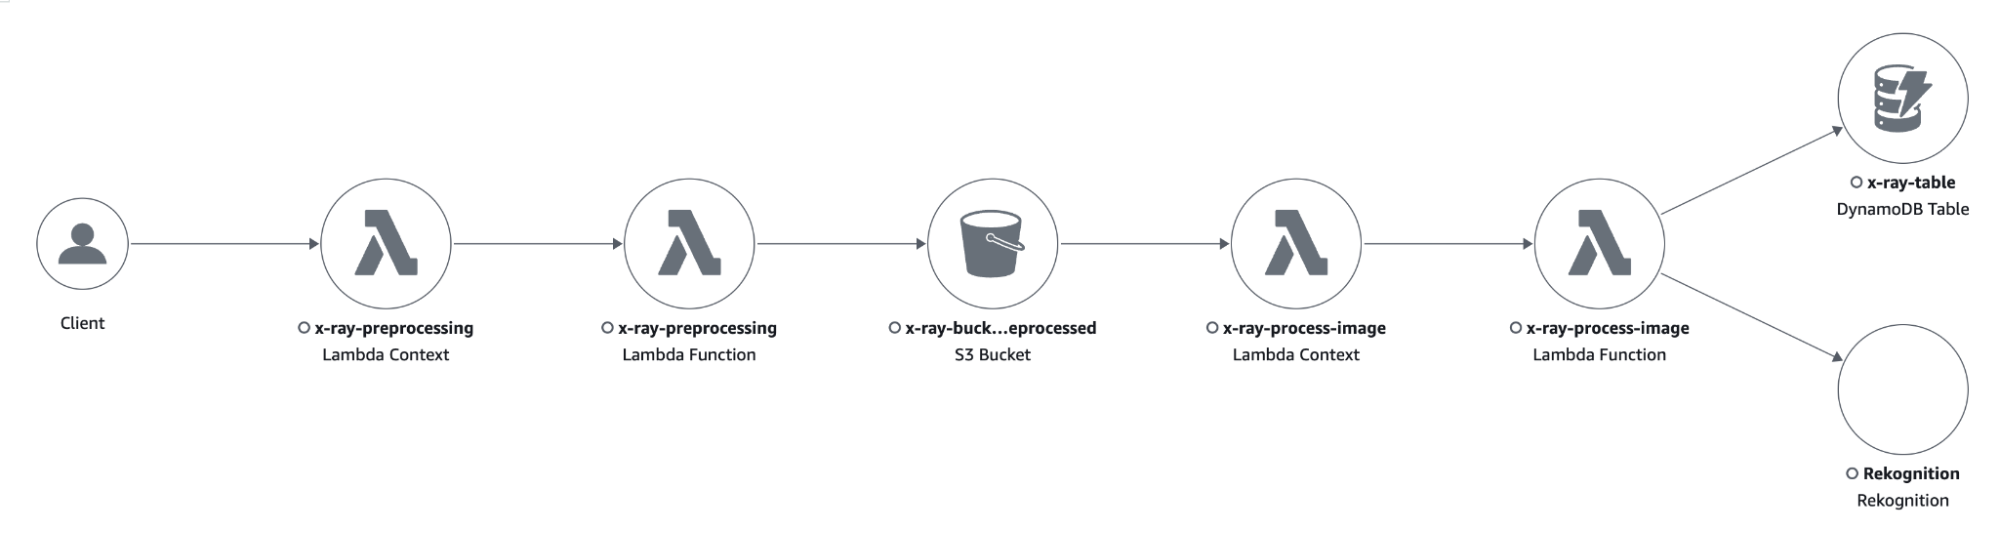
By uploading some images to the input S3 bucket, we will have an overview of how the application manages the requests' workload.
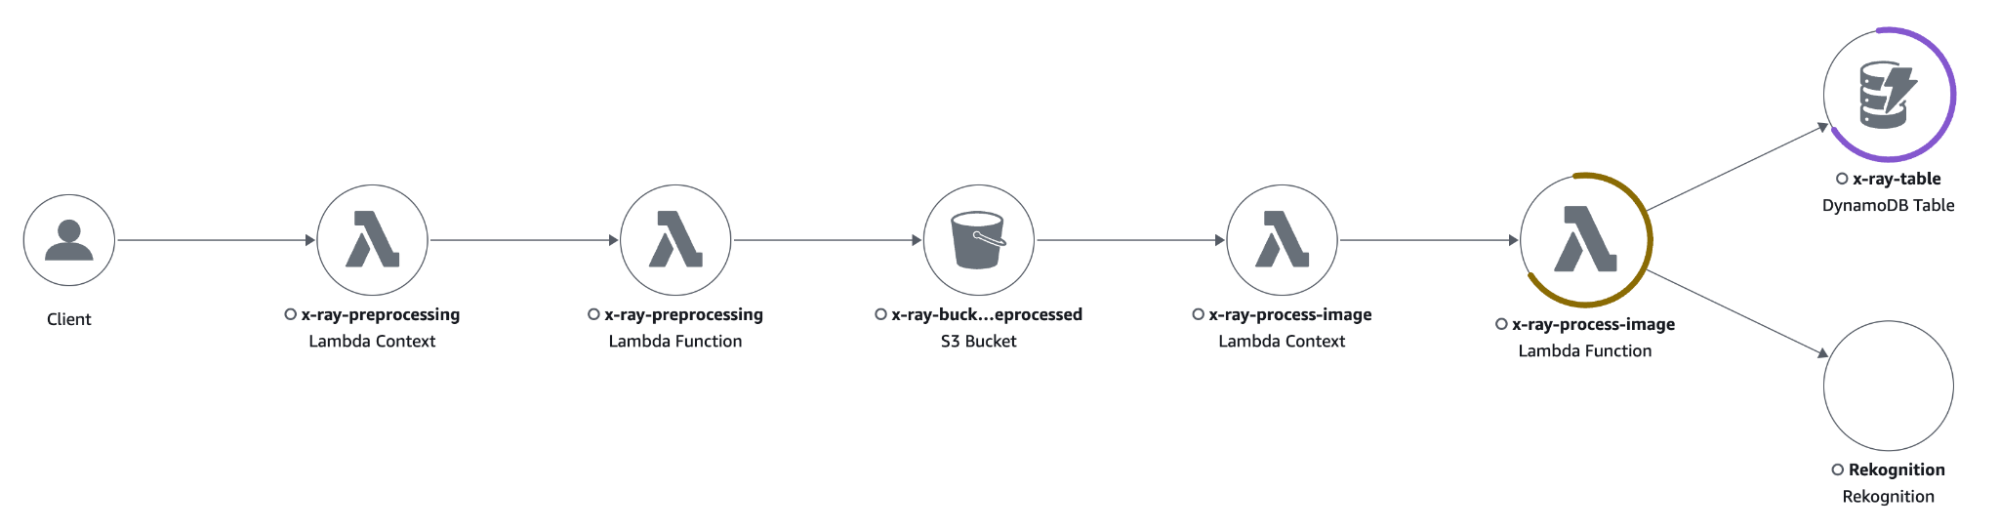
The trace map shows that the process-image Lambda function is responding with some 4xx errors caused by the throttling of the DynamoDB table.
Clicking on the icon of a resource opens a side menu with all kinds of information about the interest resource. I could quickly see what was causing the error by clicking on the “Exceptions” tab, which showed the following error: “The level of configured provisioned throughput for the table was exceeded. Consider increasing your provisioning level with the UpdateTable API”.
I changed the DynamoDB capacity mode from “provisioned” with low-capacity units to “on-demand”.
With the new configuration, the application sustained the traffic without any errors.
In a world where microservices applications are growing in number and complexity, X-Ray provides powerful tools for debugging and analysis.
We wanted to create a small guide to its fundamentals and how to enable it in AWS Lambda functions.
Our application used manual instrumentation since it was small and written as an example, but in the case of significant applications, automatic instrumentation is a faster and easier option.
Let us know if you want to learn more about it!
Proud2beCloud is a blog by beSharp, an Italian APN Premier Consulting Partner expert in designing, implementing, and managing complex Cloud infrastructures and advanced services on AWS. Before being writers, we are Cloud Experts working daily with AWS services since 2007. We are hungry readers, innovative builders, and gem-seekers. On Proud2beCloud, we regularly share our best AWS pro tips, configuration insights, in-depth news, tips&tricks, how-tos, and many other resources. Take part in the discussion!