Enabling enterprise Telemetry on AWS: Handling massive data backfills using ECS and Databricks wi...
17 June 2026 - 1 min. read
Keidi Xhafa


Everyone in IT has a sweet spot for stable infrastructures where everything runs smoothly, especially if they are on a 24/7 support schedule.
Unfortunately, most of the time, it's not easy to even understand if the infrastructure is running well, if it's a state-of-the-art cloud infrastructure, or if it's about to go up in flames.
This situation is closely related to the concept of observability, which is defined as the ability to monitor, measure, and understand the state of a system or application by examining its output, logs, and performance metrics.
As an organization grows in size and complexity, extracting information about the infrastructure's health becomes crucial. Metrics are our best friends in determining the health of an infrastructure.
Metrics are a numerical representation of data measured over time; they help identify trends, predictions, and anomalies. They should be aggregated, centralized, processed, and presented meaningfully.
The terms monitoring and observability in the AWS cloud should bring to mind Amazon CloudWatch. Everyone knows Cloudwatch, right? All the log groups, the metrics, and the events, that's it, right? Well, what if I told you that CloudWatch is much more than that?
Here are 3+1 features of Amazon CloudWatch that you may not know about.
This one is probably my favorite; with Synthetics, it is possible to create “canaries”, scripts that run on a schedule to monitor your website, endpoint, or API. With a canary, it's possible to simulate the actions of a real user, so it's really easy to periodically check and discover if a web page is unresponsive or an API is throwing errors.
There are 3 main ways to create a canary:
The most interesting option is the one with the blueprints because it shows the potential of this tool. Also, the interface is really well done; it dynamically edits the script based on the parameters set by the user, which are really easy to understand and fill.
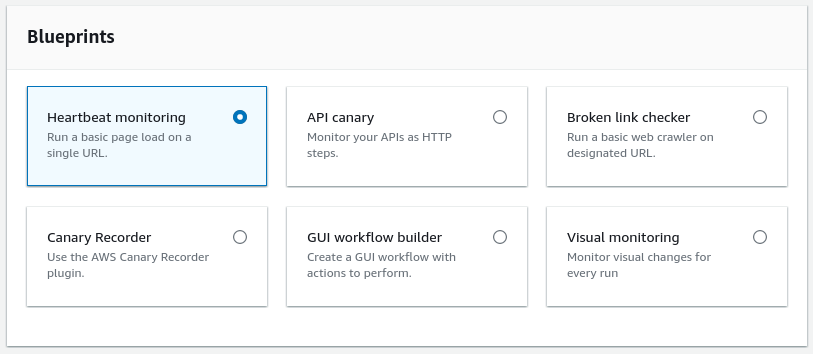
As you can see from the image, there are some really interesting use cases already provided:
The scripts can be written in both Node.js with Puppeteer and Python with Selenium, but some blueprints were missing the Python version. So, the supported runtimes consist of various combinations of different languages, libraries, and Chromium versions.
If you like to analyze metrics, there is a good chance that you also like math. If you don't, don't worry, no differential function will be used in this paragraph...maybe.
Sometimes the scaling logic of a workload is not as simple as checking if the CPU usage is above 50%. Sometimes more complex logic is needed, but Cloudwatch has us covered with the ability to use metrics obtained by combining other metrics.
Let's say a developer has just fixed a Lambda function that breaks right out of the box due to a bug, after the fix he wants to check if a function still breaks in the first milliseconds of execution. One way to do this could be to check if the duration of the function is less than a certain threshold while checking for errors.
In the picture, you can see an implementation of this example.
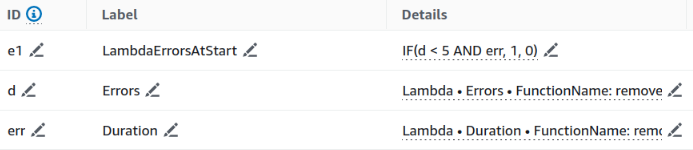
Of course, this is just a very simple example, using conditions and all the functions available in the math menu it is possible to create really complex expressions. The math menu contains a lot of functions, starting from the most common mathematical operators to conditions, conversions, sorting, filtering, and other more specific queries.
With the newly created metric, it is then possible to create CloudWatch alarms or add them to a dashboard (spoiler).
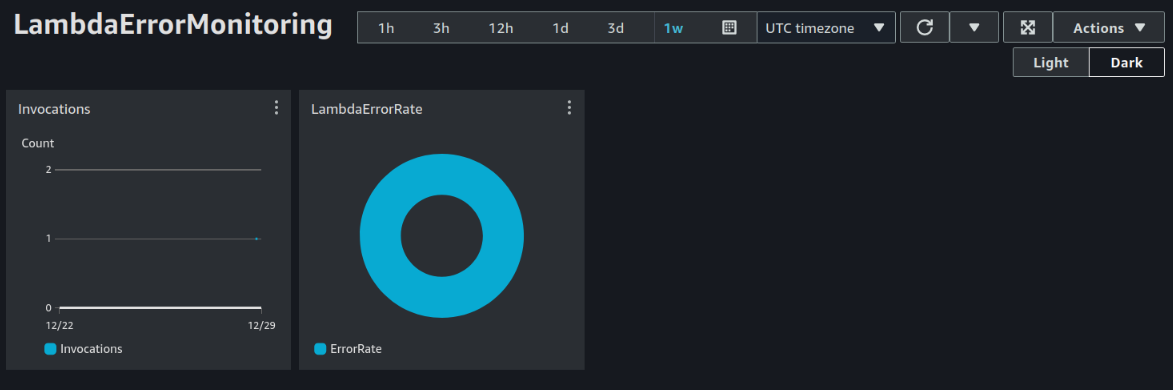
Does it even count as monitoring if it does not include dashboards? I don’t think so. That’s not a problem though, Cloudwatch dashboards are here to help. Cloudwatch dashboards make it really easy to monitor an entire workload, even composed of different services in different regions in different accounts, in a single view.
For example, here is a simple dashboard showing the number of calls to a particular Lambda function and its failure rate.
Want to share your dashboard with people who do not have an AWS account? You can share a dashboard publicly, to a list of selected email addresses, or by specifying a third-party SSO provider. Those using one of the allowed emails will need to create their unique password and use it to view the dashboard.
Additionally, it's worth noting that CloudWatch provides "Automatic Dashboards." These dashboards are pre-built, focusing on a specific service and come already populated with valuable metrics. These dashboards prove highly useful as they enable swift resource monitoring without the necessity of creating custom dashboards.
The name of this feature may remind you of the famous Unix command from the GNU coreutils...and that's right. Live Tail replicates the functionality of tail –follow, which reads the last lines of a file until stopped, but with CloudWatch.
With Live Tail it is possible to follow all logs of a selected log group without having to spam the refresh button on the log events page. But that's not all, after selecting the log group, the log stream selection is optional. This last part may not sound like a big deal, but anyone who has ever developed a lambda knows the struggle of constantly changing log streams to get the latest log, so this functionality eliminates a few clicks every time the lambda code changes, saving a lot of time (and mental energy) when debugging.
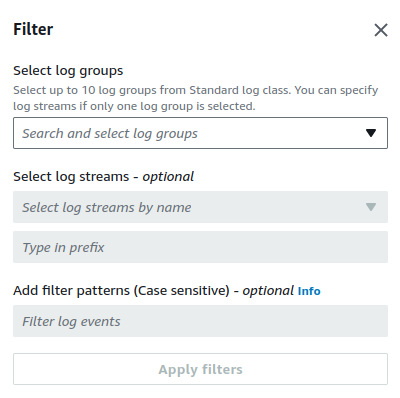
To make it easier to extract only the relevant information from the logs, it is possible to use regex, e.g:
There is also a simpler syntax:
In conclusion, monitoring is often underestimated.
It should not be limited to collecting logs “just in case”; understanding the value extracted from raw metrics is the key to infrastructure improvement and governance. Of course, a proper approach to monitoring requires effort, but it’s not wasted energy, it’s an investment. Understanding how the infrastructure performs and reacts to changes is essential to maintaining good business continuity, it helps to understand certain behaviors and makes it easier to operate in an aware manner.
Did you already know about these tips&tricks? Let us know!
Proud2beCloud is a blog by beSharp, an Italian APN Premier Consulting Partner expert in designing, implementing, and managing complex Cloud infrastructures and advanced services on AWS. Before being writers, we are Cloud Experts working daily with AWS services since 2007. We are hungry readers, innovative builders, and gem-seekers. On Proud2beCloud, we regularly share our best AWS pro tips, configuration insights, in-depth news, tips&tricks, how-tos, and many other resources. Take part in the discussion!