When Serverless runs on servers: new options for AWS Lambda and AWS Fargate with Managed Instances
04 March 2026 - 13 min. read
Damiano Giorgi
DevOps Engineer
When we interact with something, we generate data.
In 2016, a single internet user was projected to create 1.7 MB of data per second every day by 2020.
Those figures were probably underestimated.
Data is everywhere and sometimes hidden in unexpected places, like little treasures. As we'll see, this can happen for services used for what can be considered a humble purpose, but they turn out to contain valuable information.
This fact reminds me of the history of the lobster: historically, lobsters were not desired and considered food for poor people. Early Americans even used lobster as yard fertilizer and fishing bait. Prisoners and indentured servants complained because they were forced to eat lobster very often. By the 1920s, the demand for lobster started to increase until they became the precious food we know.
Let's see how we can find data in "today's lobster".
CloudWatch RUM is a relatively new addition to Amazon CloudWatch services.
It monitors real users' activity to track website performance metrics (web vitals) and identify issues within user sessions. Its real power is its X-ray integration for serverless applications, so you can track an error that occurred in a lambda and see what the user was doing. My colleagues Alessio and Daniele already told us about X-Ray.
When you deploy the CloudWatch RUM snippet on your website, it sends metrics and events to the service endpoints. Data will be available for visualization in the dashboard.
This is an example:
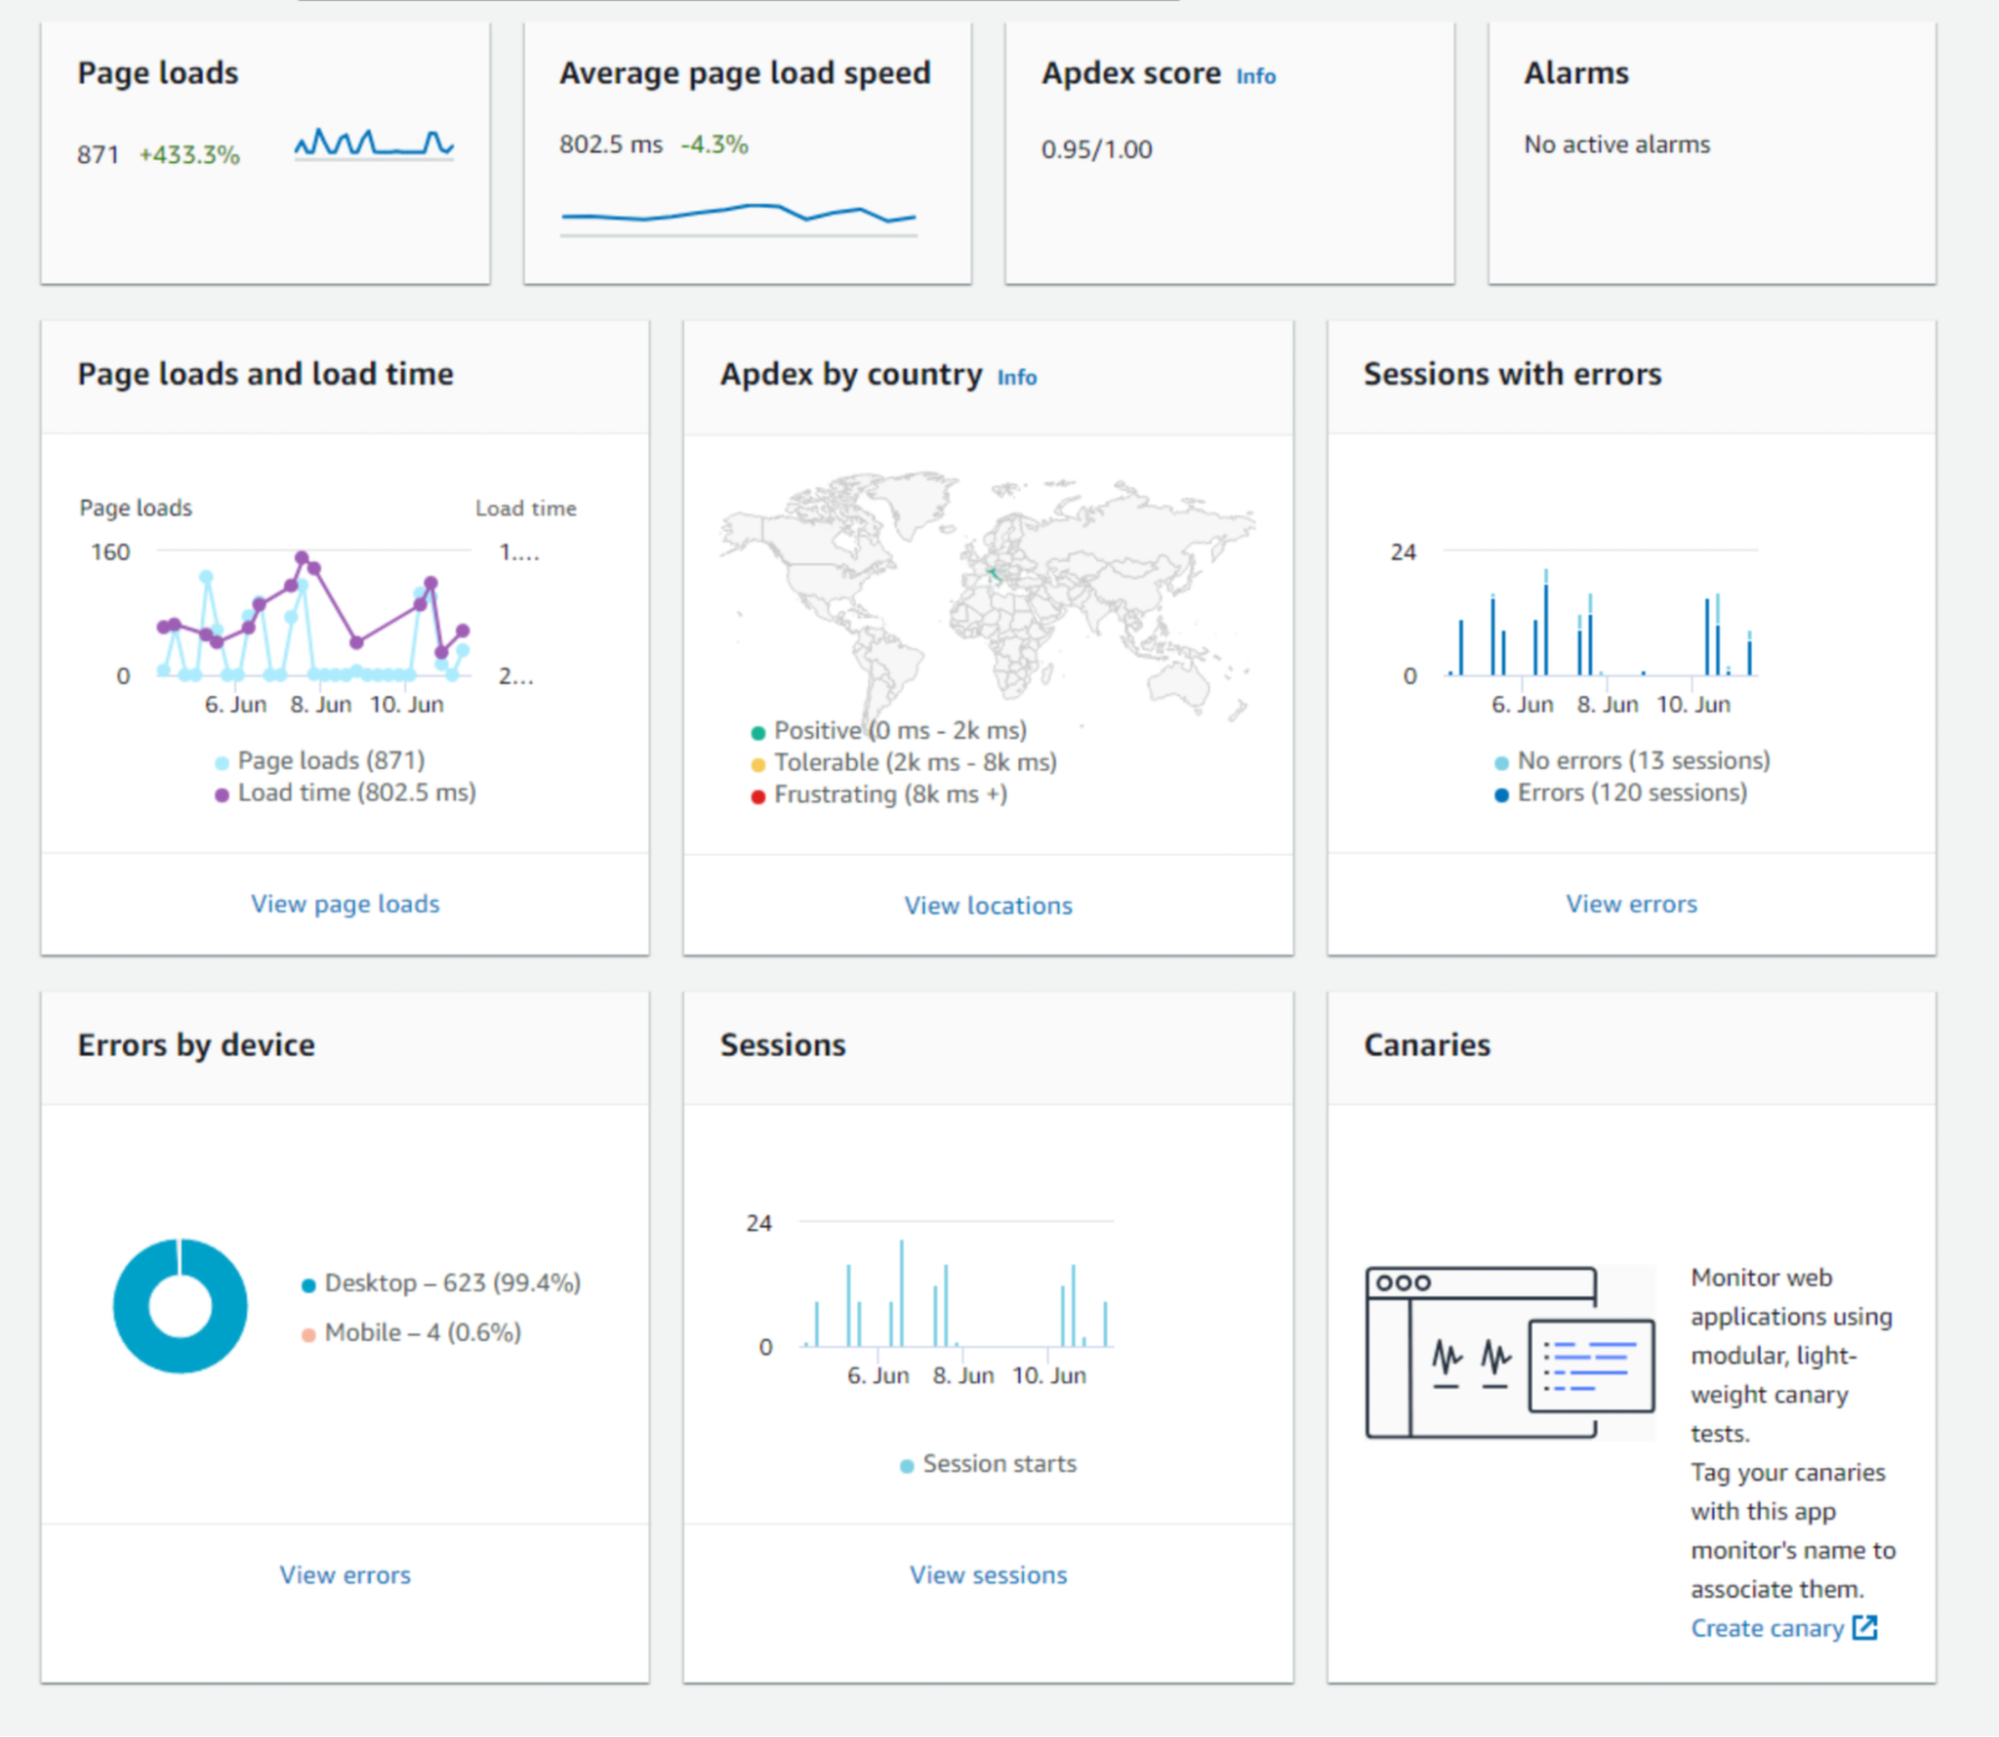
You can also see sessions, user journeys, and detailed error statistics.
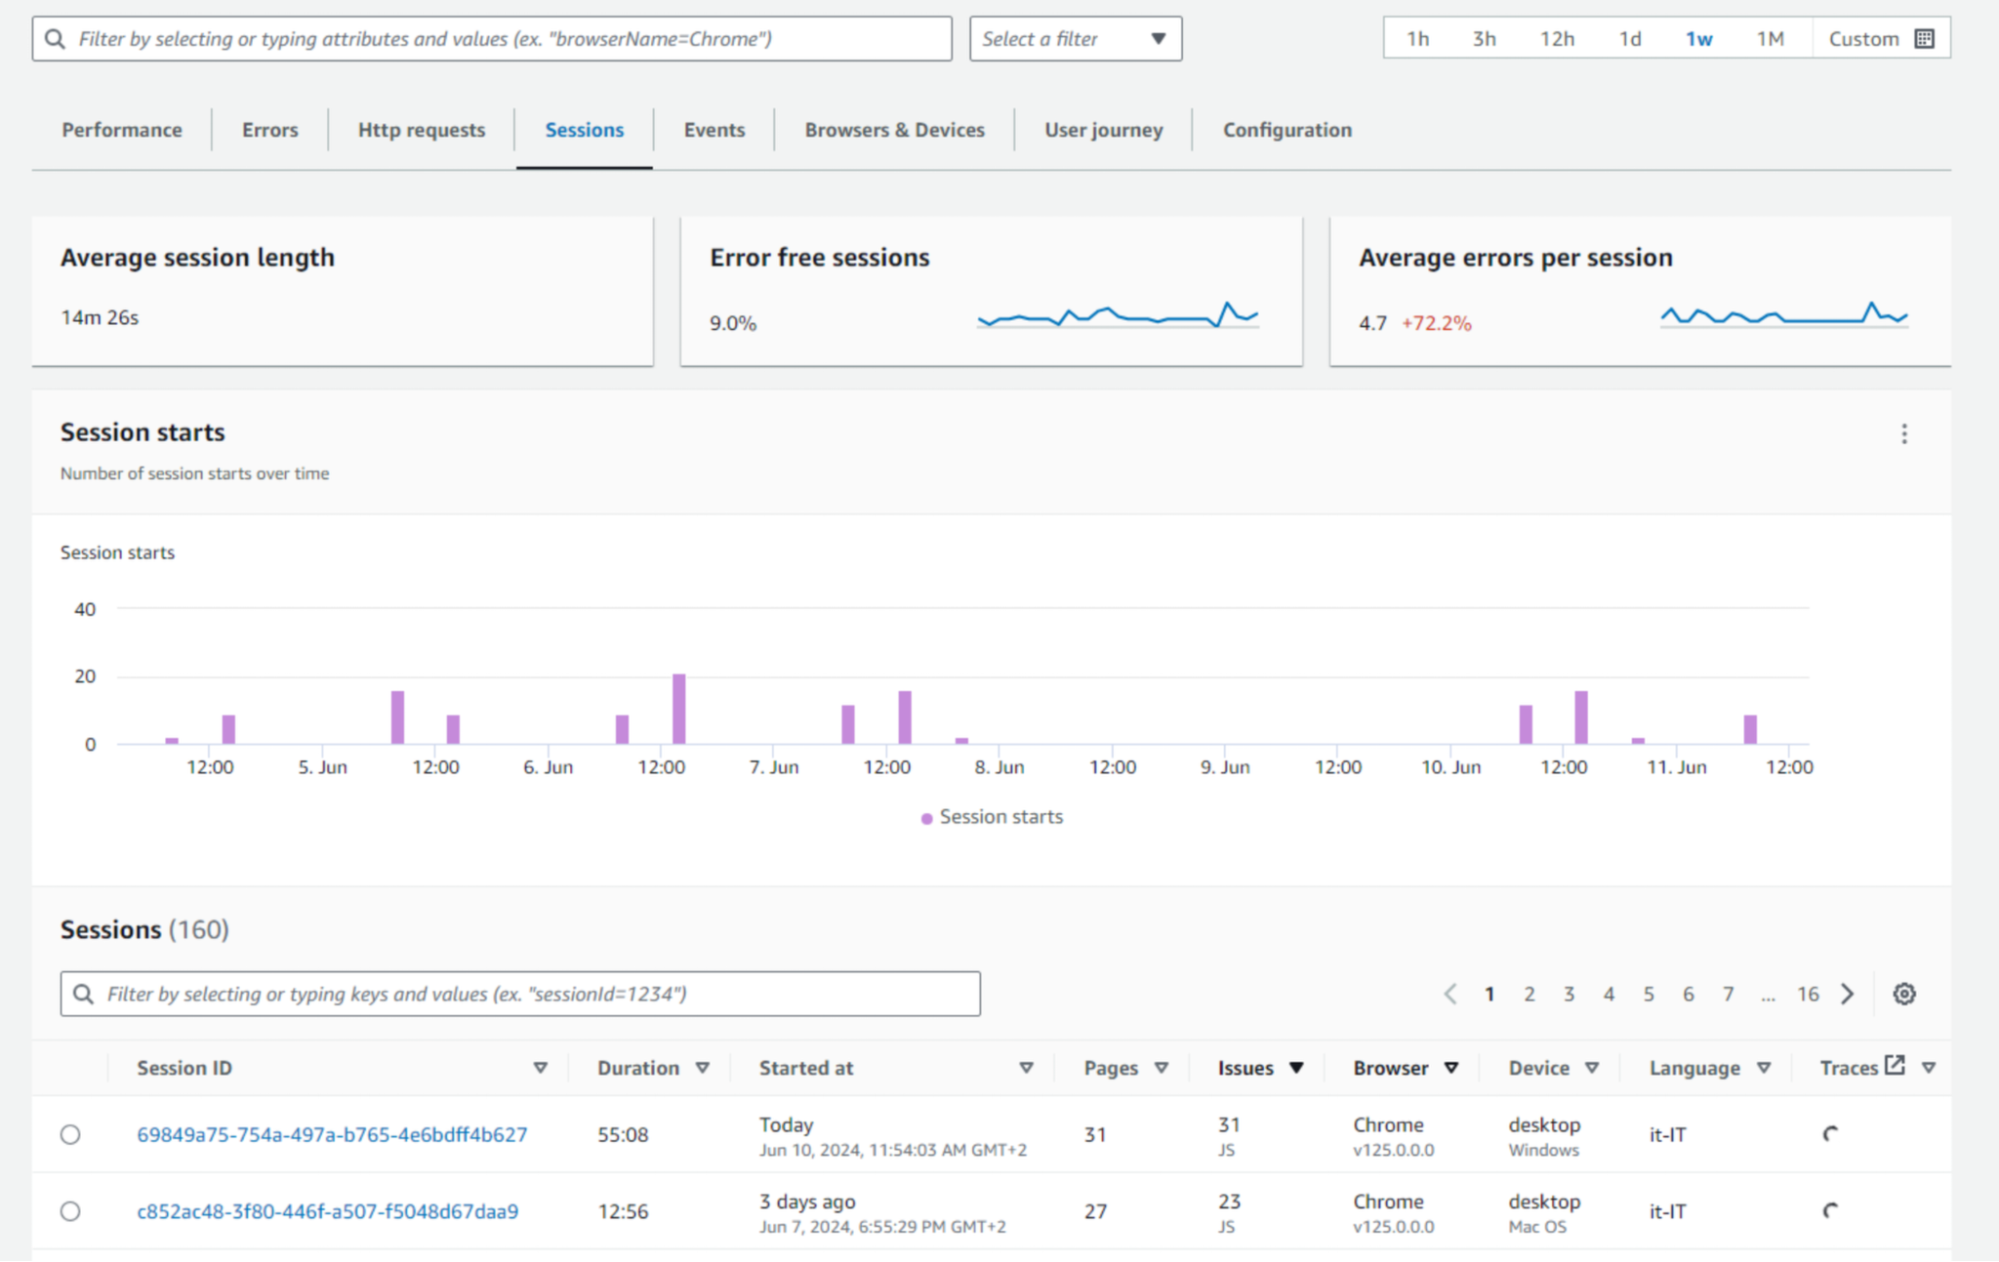
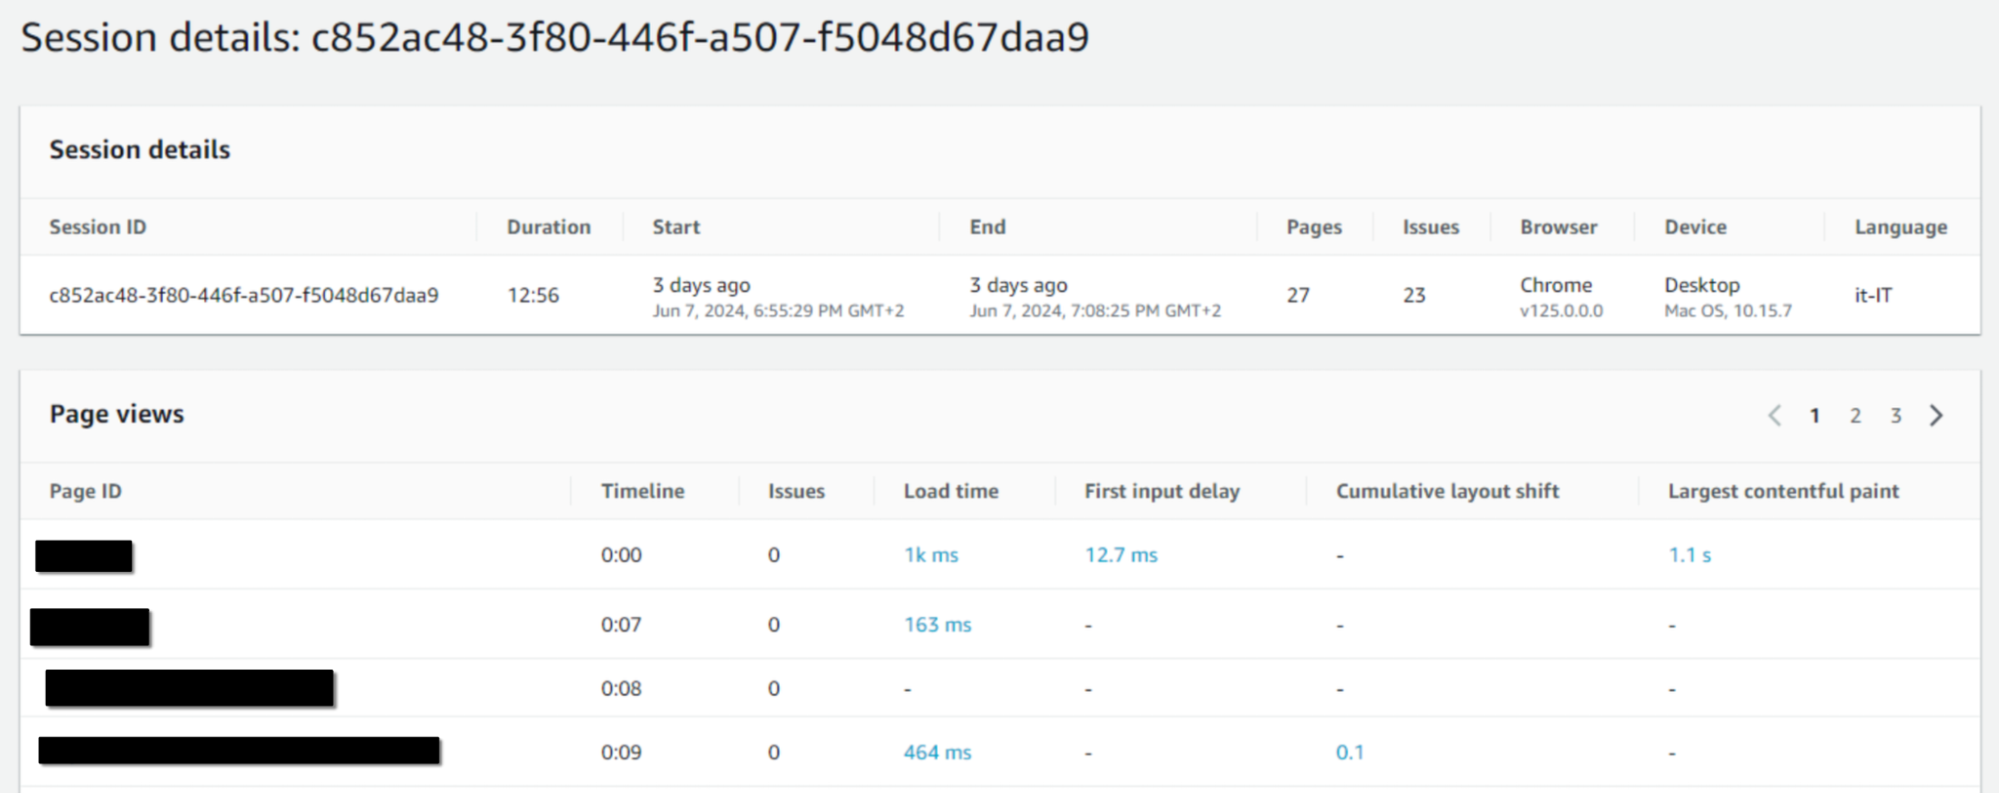
Besides being a useful tool, it can help us turn our business into data-driven.
While this service is always used as a monitoring and reporting tool, it can also be used to extract data to reveal hidden insights: in fact, its real value relies upon the events and metrics captured by the service.
Let's unveil them and see their real potential.
As we said, the first kind of data (readily available and accessible) is metrics, such as page views, session counts, and so on. You can find a list here.
You can also define custom metrics based on events. For example, you can define a custom metric that counts only Chrome and Safari access from the US.
As with every metric, you can set up alarms and define metric maths, but this isn't something new for us.
The second kind of data you can collect is less evident but more valuable: raw events generated by real users.
When you configure RUM, you can enable CloudWatch Logs integration. This integration stores all user-generated activity events in a JSON log group.

Be aware that log groups don't set data retention by default, and RUM generates a lot of data. This sample is for a single-page view.

So, we finally have navigation and performance data ready; this is a sample entry for an event:
{
    "event_timestamp": 1718098736000,
    "event_type": "com.amazon.rum.performance_navigation_event",
    "event_id": "91ee89c6-044d-476c-8227-743c8f1b21d1",
    "event_version": "1.0.0",
    "log_stream": "2024-06-11T02",
    "application_id": "48e6845a-7799-4e76-90f6-a3602dac887a",
    "application_version": "1.0.0",
    "metadata": {
        "version": "1.0.0",
        "browserLanguage": "en-US",
        "browserName": "Edge",
        "browserVersion": "125.0.0.0",
        "osName": "Linux",
        "osVersion": "x86_64",
        "deviceType": "desktop",
        "platformType": "web",
        "pageId": "/",
        "interaction": 0,
        "title": "test",
        "domain": "blog.besharp.it",
        "aws:client": "arw-script",
        "aws:clientVersion": "1.16.1",
        "countryCode": "IT",
        "subdivisionCode": "PV"
    },
    "user_details": {
        "userId": "ac3f587b-3887-4661-8200-52d8ce5768f7",
        "sessionId": "13df94e4-7076-44a2-8b49-5dbb49e55e59"
    },
    "event_details": {
        "version": "1.0.0",
        "initiatorType": "navigation",
        "navigationType": "navigate",
        "startTime": 0,
        "unloadEventStart": 0,
        "promptForUnload": 0,
        "redirectCount": 0,
        "redirectStart": 0,
        "redirectTime": 0,
        "workerStart": 0,
        "workerTime": 0,
        "fetchStart": 4.7999999998137355,
        "domainLookupStart": 34,
        "dns": 0,
        "nextHopProtocol": "h2",
        "connectStart": 34,
        "connect": 15.799999999813735,
        "secureConnectionStart": 37.90000000037253,
        "tlsTime": 11.899999999441206,
        "requestStart": 50.10000000055879,
        "timeToFirstByte": 151.8999999994412,
        "responseStart": 202,
        "responseTime": 1.1000000005587935,
        "domInteractive": 276.20000000018626,
        "domContentLoadedEventStart": 276.20000000018626,
        "domContentLoaded": 0,
        "domComplete": 452.1000000005588,
        "domProcessingTime": 249,
        "loadEventStart": 452.1000000005588,
        "loadEventTime": 0.09999999962747097,
        "duration": 452.20000000018626,
        "headerSize": 300,
        "transferSize": 944,
        "compressionRatio": 2.0683229813664594,
        "navigationTimingLevel": 2
    }
}
Knowing where our data is, we can now export it into our DataLake, for example, integrating CloudWatch logs with Kinesis Firehose to write events on S3.
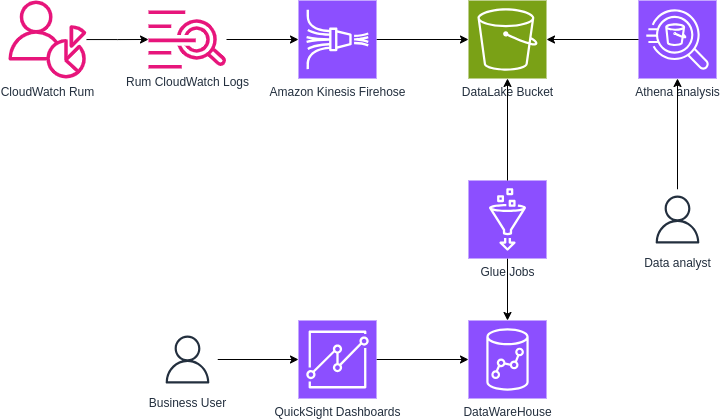
Once data is exported, you can leverage all this information and integrate it into internal analysis tools, and the possibilities are endless.
Think about correlating sales for an e-commerce website with user location, page response time, or session navigation data.
You could discover unexpected results, such as weather conditions influencing sales in a particular area. You can also generate custom events in RUM that can act as placeholders and ease the job of behavior correlation.
With all this information, you can better understand your users and your SEO positioning, streamline internal processes, or simply have a better monitoring system so you will know who and when to alert in case of anomalies and outliers in data. Don't forget about making pretty dashboards for internal and external customers; everyone loves a good dashboard :)
Once you enrich your existing DataLake, even with information intended for monitoring, you can make accurate data-driven decisions.
This solution does not aim to replace Google Analytics but to ease data integration and analysis: You can export data from GA-4 to BigQuery, but if you have an AWS DataWareHouse solution in place, its integration can take time. We aim to support business decisions rather than put effort into maintaining integrations between different systems.
Choosing the right data source instead of working on integrations can be beneficial. Sometimes, you have to dig into services to find that you already have all the information you want (and sometimes a lot of it!).
As you can see, if you are already using CloudWatch RUM, you can leverage its integration with AWS services with little effort, using only managed services, even if you didn't think about it.
Have you ever thought about getting data from unusual sources?
What kind of correlation can you think of after knowing this integration? Let us know in the comments!
Proud2beCloud is a blog by beSharp, an Italian APN Premier Consulting Partner expert in designing, implementing, and managing complex Cloud infrastructures and advanced services on AWS. Before being writers, we are Cloud Experts working daily with AWS services since 2007. We are hungry readers, innovative builders, and gem-seekers. On Proud2beCloud, we regularly share our best AWS pro tips, configuration insights, in-depth news, tips&tricks, how-tos, and many other resources. Take part in the discussion!