How to Use Amazon Bedrock to Deploy Foundation Models in Production (Complete Guide)
22 April 2026 - 7 min. read
Damiano Giorgi
DevOps Engineer
In the past, we covered continuous delivery pipelines in multiple blog posts; that's because having an automatic, reliable, and fully managed way to test and deploy code helps to increase development throughput and the quality of the production code.
An efficient CI/CD pipeline is necessary to accelerate software delivery without sacrificing quality, and a static code analysis tool should be a step of each continuous delivery pipeline.
A static code analysis tool inspects your codebase through the development cycle, and it's able to identify bugs, vulnerabilities, and compliance issues without actually running the program.
The code analysis may help to ensure that your software is secure, reliable, and compliant.
Static code analysis is a practice that allows your team to automatically detect potential bugs, security issues, and, more generally, defects in a software's codebase. Thus, we can view static analysis as an additional automated code review process. Let's examine this analogy more in detail.
The code review process is probably the better way to improve the quality of the code. During a code review, a pair of programmers read the code with the precise goal to improve it and to spot dangerous practices from both maintainability and security perspectives.
During the review process, the code's author should not explain how certain program parts work so that the reviewer is not biased on its judgment. In addition, the code should be clear to understand and highly maintainable; the complexity of the code should be mitigated by abstraction and incapsulation. Finally, the code should be deemed sufficiently clear, maintainable and safe, by both the programmers to pass the review.
The code review usually works well because it's easier for the programmer to spot bugs, code smells and to suggest improvements on somebody else code.
It would be best to practice code reviews as frequently as possible; however, the activity is very time-consuming and costly.
An excellent way to increase the frequency of code reviews is to include static code analysis in the delivery pipeline.
There are instruments and solutions to implement static code analysis that can automatically scan your codebase and generate an accurate report for the developers. Such tools are usually easy to integrate as a step in the continuous delivery pipeline; usually, the return code can determine if the code is good enough or if the release fails the static analysis.
Of course, a fully automated solution cannot substitute a complete code review performed by a developer. Still, the increased ratio of code analysis plus the relatively cheap impact on overall pricing makes adding an analysis step to your pipeline an efficient way to improve code quality and security.
There are three main categories of improvements that static code analysis can pinpoint:
Many commercial and free static code analyzers support a vast plethora of programming languages. One of the most famous is Sonarqube, which we will better describe later.
From AWS, we can also leverage CodeGuru, a machine learning-powered service that is easy to integrate into pipelines and can provide high-quality suggestions to improve the code. Unfortunately, at the moment, CodeGuru only supports Java and Python (in preview).
CodeGuru aims to become a robust and high-quality analysis tool. However, at the moment, it’s only stable to use for java developers; thus, we will focus on a more mature solution that can be used for a lot of languages.
This article will deep dive into Sonarqube and how to integrate it into a continuous delivery pipeline.
Sonarqube is open-source software for continuous inspection of code quality. It performs automatic reviews with static analysis on more than 20 programming languages. It can spot duplicated code, compute code coverage, code complexity, and finds bugs and security vulnerabilities. In addition, it can record metrics history and provides evolution graphs via a dedicated web interface.
The drawback of using SonarQube is that you can either subscribe to the managed SonarQube service (not provided by AWS) or manage your own installation.
We usually leverage fully managed services for the development pipeline because it allows us to focus on our work rather than the infrastructure or tools needed to make the pipeline.
However, in this case, we opted for a hosted solution due to a pricing model not compatible with our usage. In addition, the automatic review step is not a pipeline blocker during development, making the availability of the cluster not critical for the development cycle.
This brief tutorial will provide high-level instructions to set up a SonarQube cluster on AWS leveraging managed services.
We will make a highly available and scalable cluster powered by ECS Fargate and Amazon Aurora Serverless.
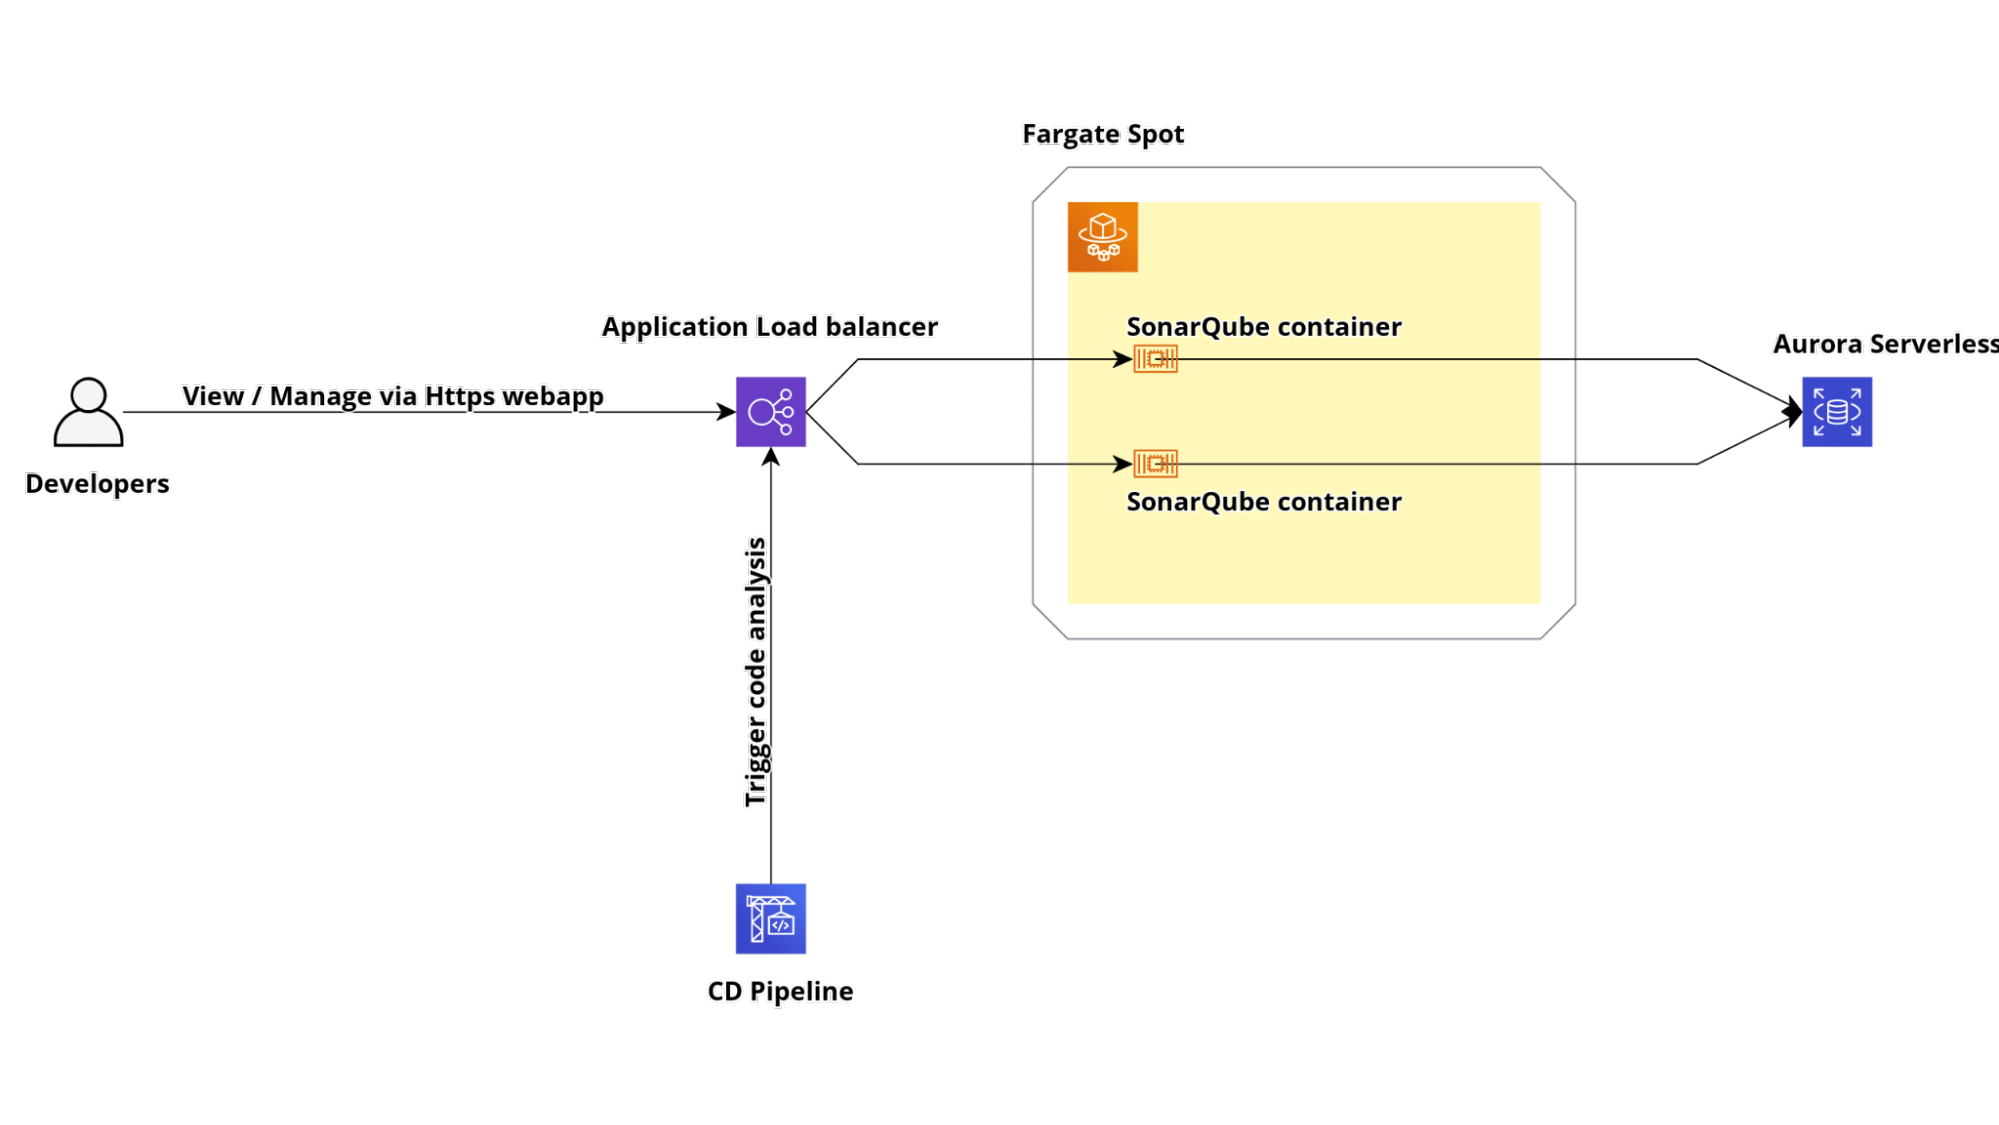
To work correctly, SonarQube needs a PostgreSQL or MySQL database. Therefore, we will use Amazon Aurora Serverless with PostgreSQL compatibility.
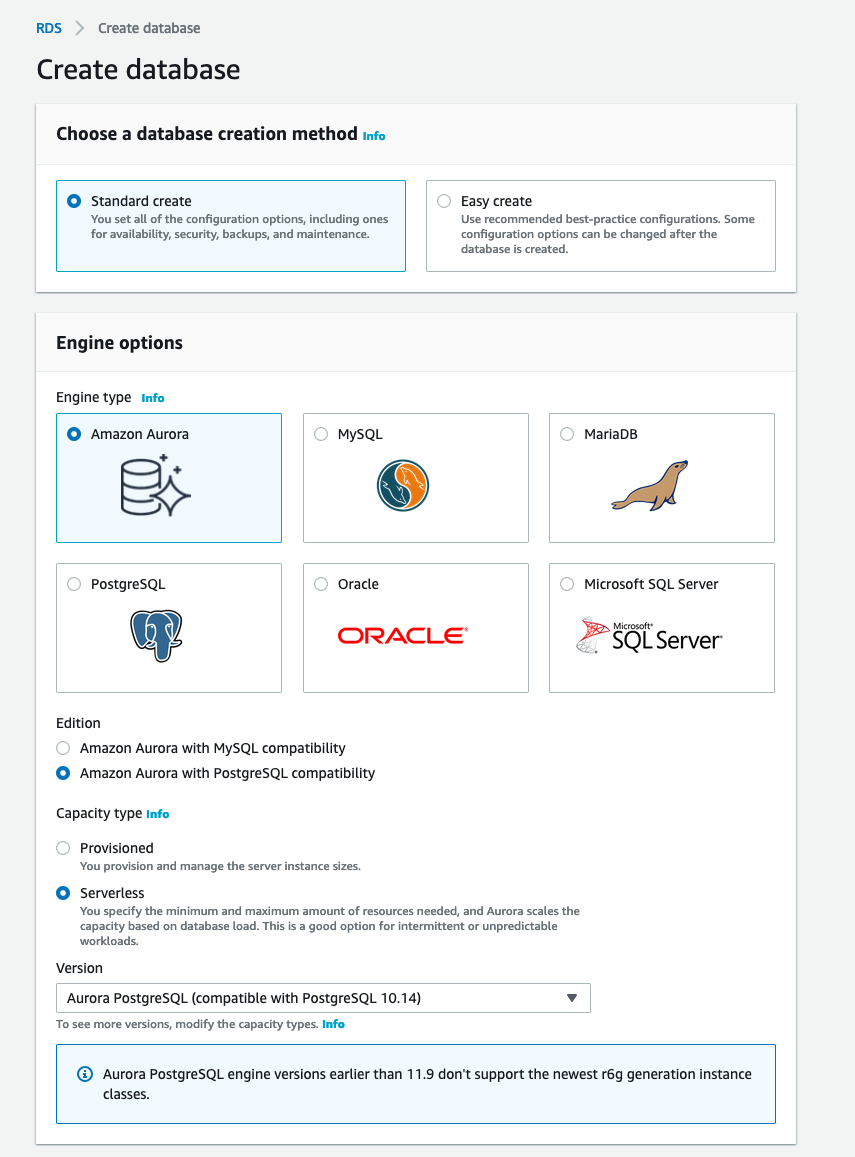
To create it, simply go to the AWS Management Console under the AWS RDS service and click the button "Create database.” In the following form, select Amazon Aurora as Engine type, Amazon Aurora with PostgreSQL compatibility as Edition, and Serverless as the Capacity type like the image below.
Finally, finish the cluster configuration setting up the database name, password, and all the networking configuration.
To expose the Fargate service that will contain our Sonarqube Application, we need to create an AWS Application Load Balancer with his Target Group. If you want to serve it using the HTTPS protocol, you have to create or import an SSL certificate inside the AWS Certificate Manager. Otherwise, in the creation of the load balancer, you can only configure the listener on port 80.
Let's start creating the Target Group from the AWS Management Console under the EC2 service page. Go to the Target Group section and click the "Create target group" button. Choose "Ip address" as target type, HTTP as protocol, and 9000 as the port; also, make sure to select HTTP1 as the protocol version.
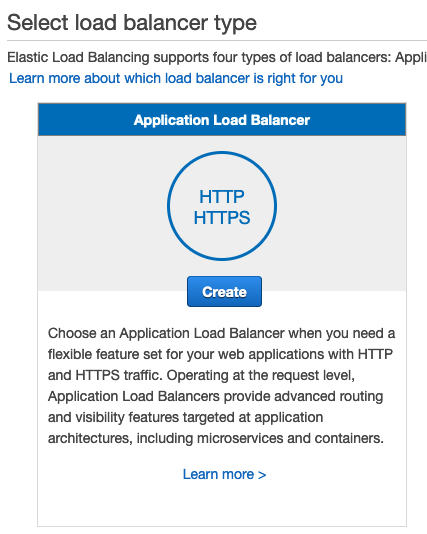
Now that we have our Target Group, we can create the Application Load Balancer. To do that, simply go to the load balancer section inside the EC2 Console and click the Create Load Balancer button. Then, click the Create button under the Application Load Balancer Section in the wizard as in the image below.
Choose the internet-facing scheme and add two listeners, one on 80 port and one on 443 port. Remember to attach it to the public subnet of your VPC like the image below.
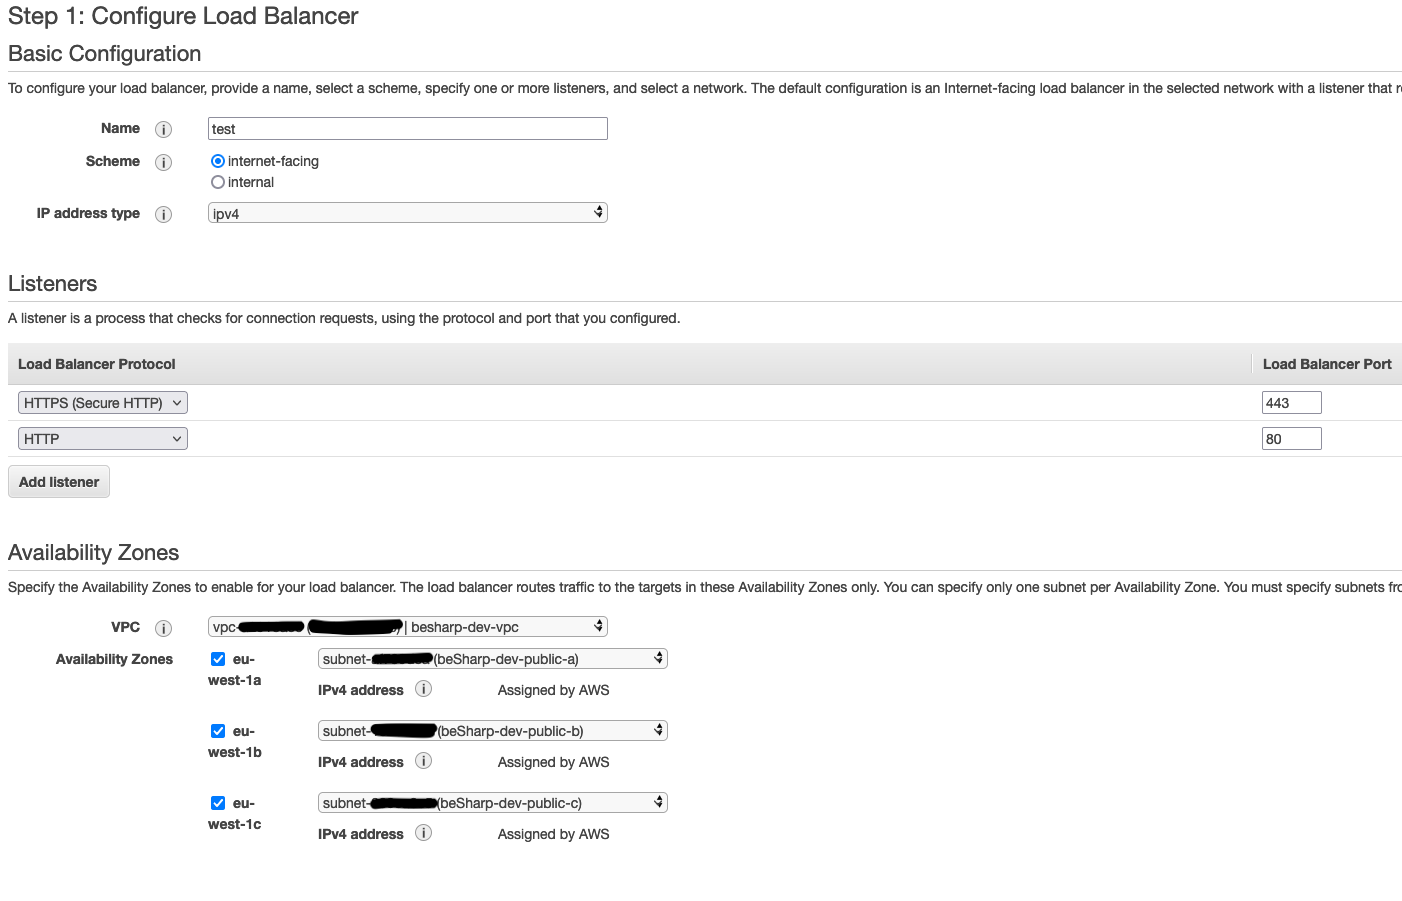
In the next section (only if you choose to have the 443 port listener), select an SSL certificate from AWS Certificate Manager.
Then, in the configure routing section, just select the Target group that you have already created.
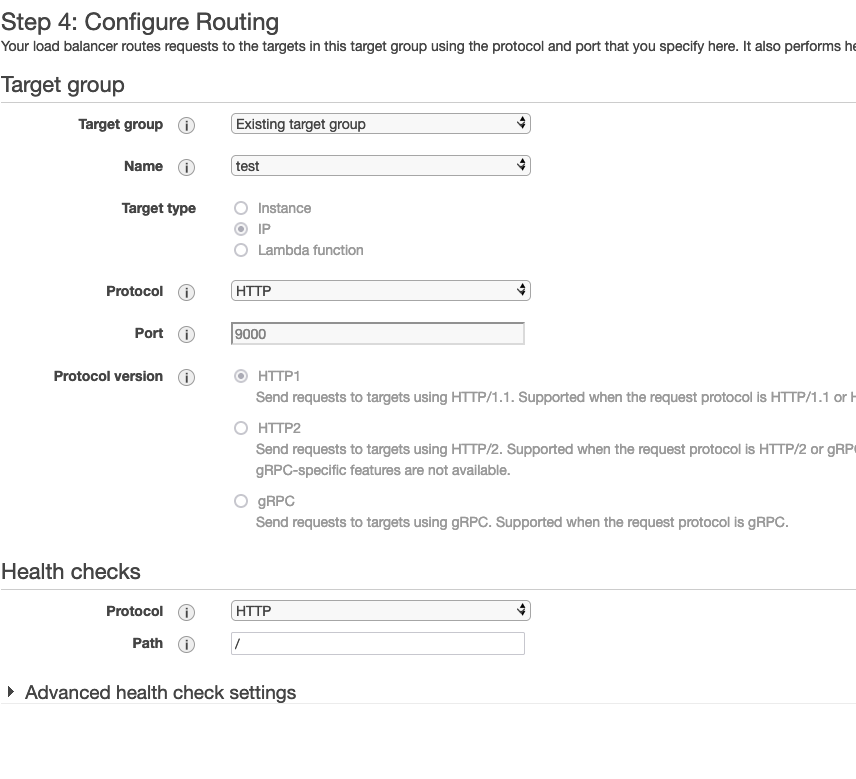
If you choose to have the 443 port listener, you have to change its behaviour. To do that, simply select your load balancer; in the Listener section, select the port 80 listener and then click the Edit button.
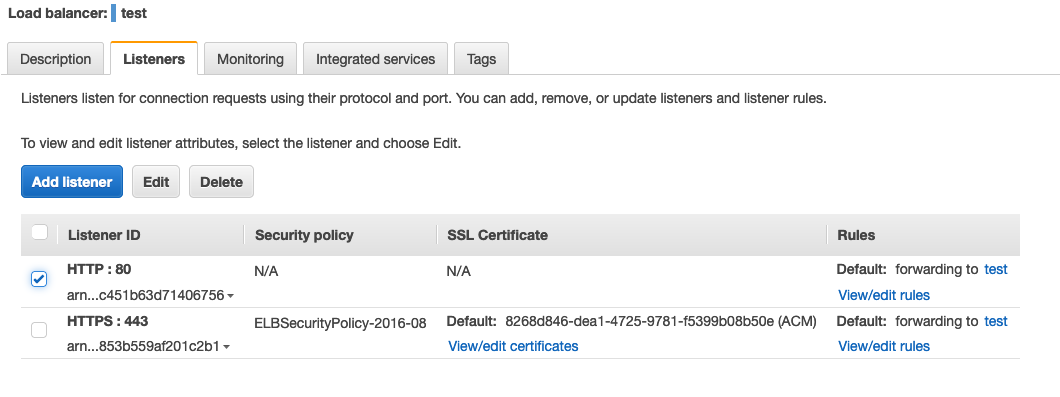
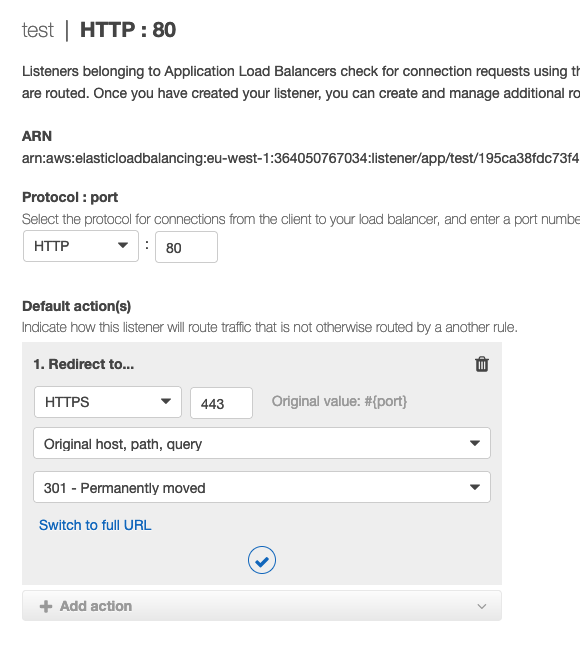
In the edit page, delete the default behaviour and re-create it by clicking the button "Add action”. In the checklist, select the "Redirect to" value and insert the 443 port in the appropriate box.
Go to the AWS ECS console under the Amazon ECS Cluster section and click the "Create cluster" button. Next, select the "Networking only" template like the image below.
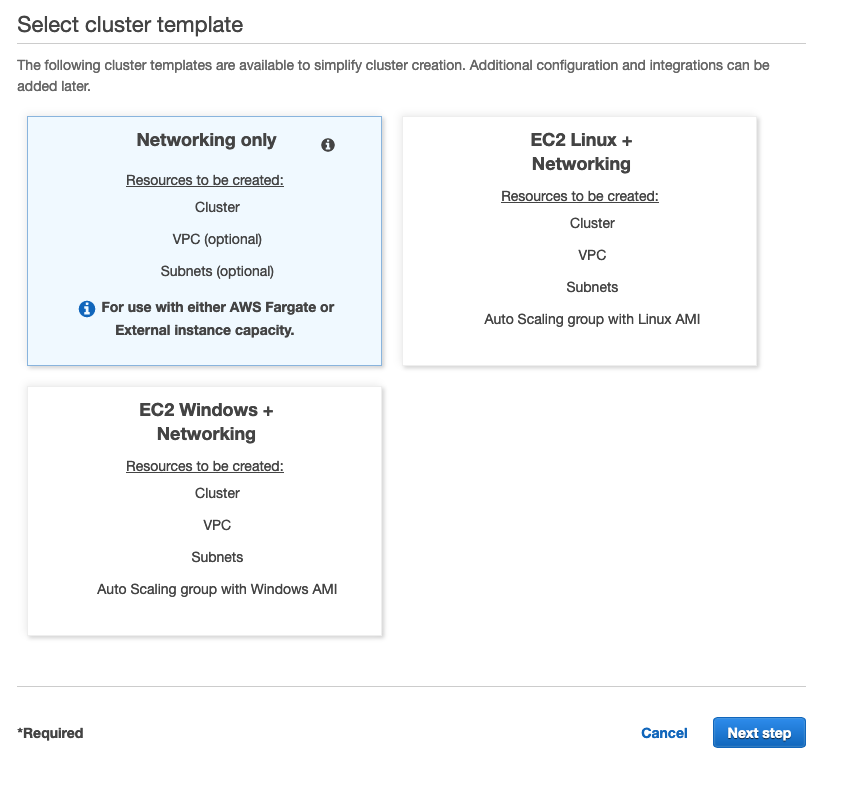
Choose a name and click the "Create" button.
In the IAM Management Console, create a new IAM Role and attach the AWS Managed policy called "AmazonECSTaskExecutionRolePolicy" and "AmazonEC2ContainerServiceRole ".

In the AWS ECS Task Definition section, click the button "Create new Task Definition" and choose the Fargate launch type.
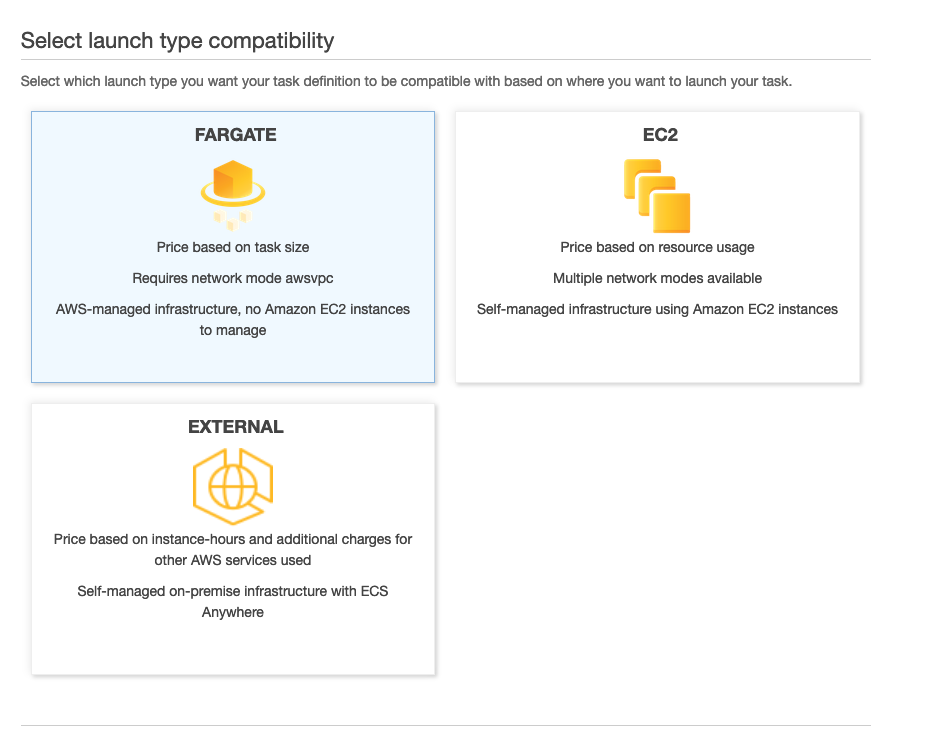
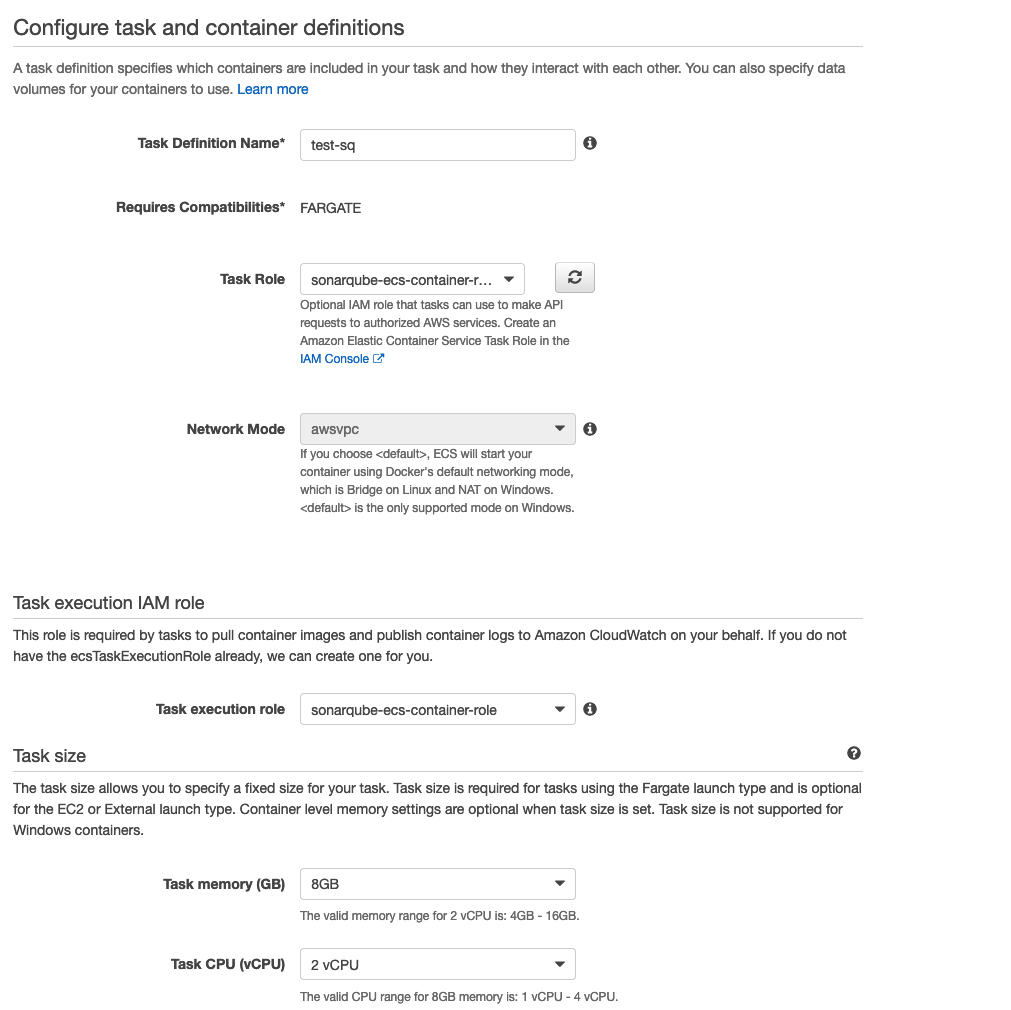
As the "Task role" and "Task execution role" properties, select the role you have created.
In the "Task size" section, select 8GB for the ram and 2 CPU.
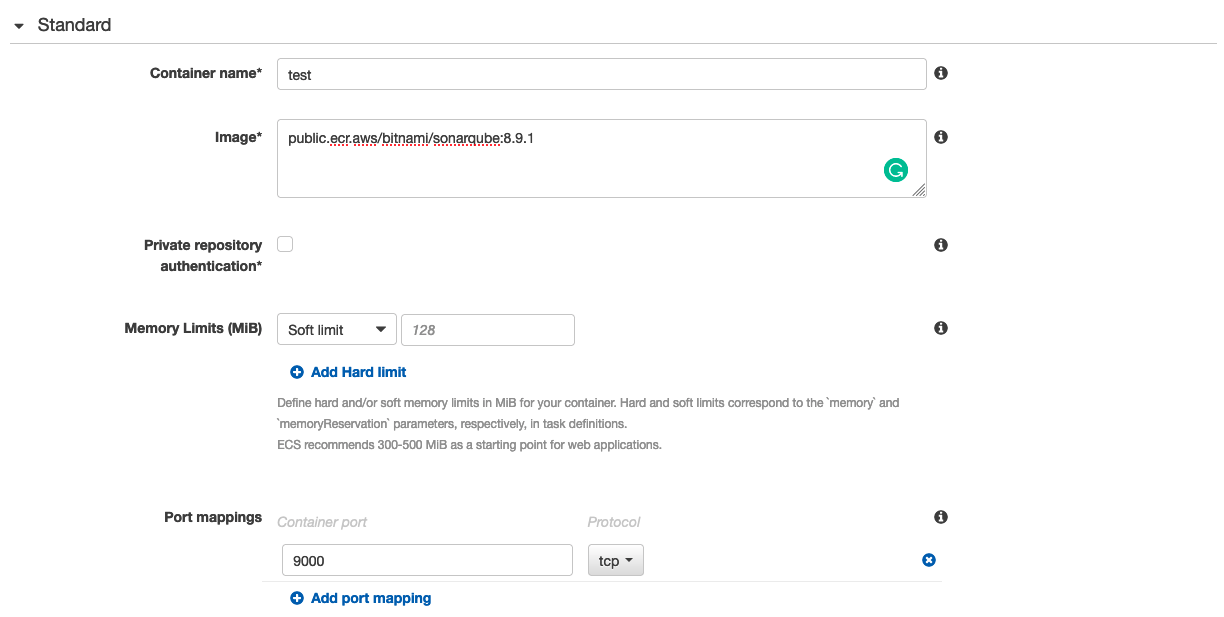
In the container section, add a new container and use "public.ecr.aws/bitnami/sonarqube:8.9.1" as the image of the task. This image is the official version of Sonarqube hosted by AWS ECR Public. If You want, you can use your ECR private repository with your custom Docker image. In the port mapping, map the 9000 port of the container.
In the Environment Variable section, you have to add the database endpoint using these variables:

At this point, you can configure a service for the SonarQube cluster. For example, you can define a service specifying a task and a set of parameters that determine how many instances of the task are required as a minimum, current, and maximum value to allow the service to function correctly. You can read more on how to set up a service in our previous article here.
In the end, you should be able to access your installation using the elastic load balancer URL.
Now that the cluster is up and running, we can access it and start configuring SonarQube. We can fine-tune the inspection configuration and preferences. Once our project is created and configured, we can automatically trigger a code analysis, adding a step in our CD pipeline.
There are multiple ways to achieve this. The most common and easy to implement is just to add a piece of script into the build step. To trigger a code analysis, you have to install an agent and then run a command to start the process.
The agent can be pre-installed in the build container, the latest release of the agent is available here for download.
When the agent is in place, you can start an analysis by running this command.
sonar-scanner
-Dsonar.projectKey=[PROJECT_KEY]
-Dsonar.sources=.
-Dsonar.host.url=[LOAD_BALANCER_URL]
-Dsonar.login=[LOGIN_KEY]
-Dsonar.qualitygate.wait=true
-Dsonar.qualitygate.wait=true
The last parameter tells the scanner to wait for the scan to end and return a non 0 exit code if the quality of the release is below the configured threshold.
In this way, the build step of the pipeline will fail if the code quality isn’t good enough.
Whenever the pipeline stops when the scan fails is a crucial aspect of the entire process.
As already suggested, code analysis is cheap and should be executed as much as possible. However, the development process should be halted every time a code analysis fails.
It’s good to scan and generate the report at each commit without stopping the release, especially in the dev environment.
However, the pipeline can be hardened in staging and production environments to ensure that the quality is not impaired. Pipelines that deliver to any “non-dev” environment should fail if the code analysis is not good enough, using the parameter highlighted above.
Static code analysis is a reliable and precious practice to include in the development cycle.
There are both AWS options like CodeGuru and many commercial and/or open-source platforms like SonarQube that you can subscribe to or host.
No matter what your application does or how your development cycle is structured, if you have continuous delivery pipelines, you should consider adding an automatic code analysis step and ensure that the release stops for customer-facing environments if the code quality is not satisfactory.
Stay tuned for other articles about code quality and automatic delivery pipelines.
See you in 14 days on #Proud2beCloud!