Enabling enterprise Telemetry on AWS: Handling massive data backfills using ECS and Databricks wi...
17 June 2026 - 1 min. read
Keidi Xhafa


With human society transforming to a wholly digitally connected community, the amount of generated and collected data is growing outstandingly. Nowadays, we have enormous amounts of data available about both internal business processes and customer’s behaviors.
This provides us the opportunity to exploit ever-larger quantities of information of ever-better quality at a reduced cost.
A fitting example is customer behavior profiling: businesses can gather information about what products customers use, how they use them, which aspects of each product are really relevant in their daily life, and a lot more.
Moving from everyday life to industry, it is now possible to obtain information on which components of machinery are subject to wear and act accordingly (predictive maintenance). It is also possible to obtain data about defective pieces to improve the production lines, and so on.
The ability to understand which data to extract, to collect it efficiently, to store it at low cost and finally to analyze it is therefore what really makes the difference, and it is a significant competitive advantage.
The effort to analyze this astonishing amount of data becomes challenging using only traditional on-premise solutions. AWS provides a broad set of fully managed services to help you build and scale big data applications in the Cloud. Whether your application requires real-time streaming or batch processing, Amazon Web Services has the services needed to build a complete data analytics solution.
To collect, store, and analyze data we need to deep dive into 4 fields that are commonly needed regardless of the type of project and implementation: Collection, Data Lake / Storage, Processing, Analysis and Visualization.
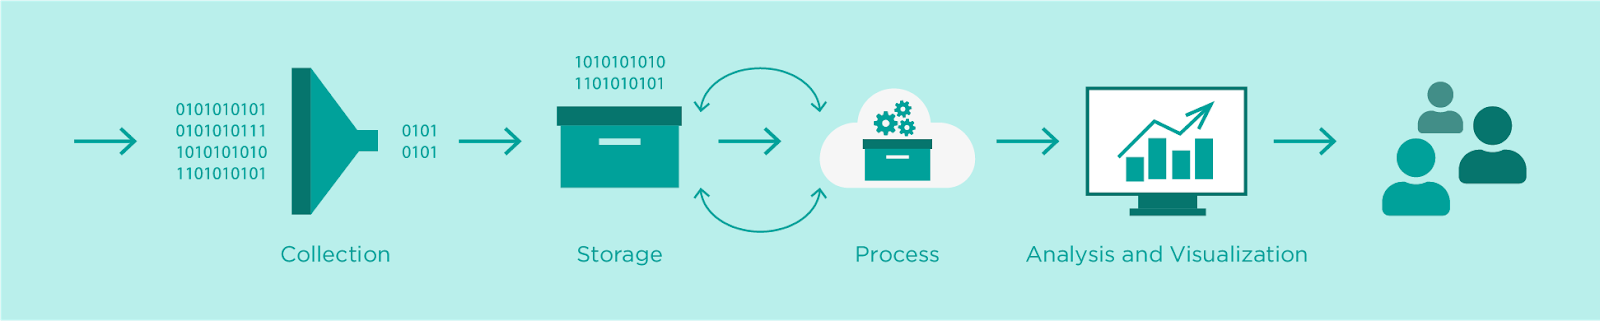
So generally, the steps of a typical data analysis pipeline can be summarized as follows:
In the following sections, we will discuss each of the steps, with a focus on AWS services you can leverage to seamlessly implement the pipeline steps.
In order to design the correct data collection system, you need to think about the features of the data and consider the expectations regarding data latency, cost, and durability.
The first aspect to consider is the ingestion frequency, which It is the measure of how often the data will be sent to your collection system. It can also be referred to as the temperature (Hot, Warm, Cold) of the data. The frequency of the input data dictates the kind of infrastructure to design. Transactional data (SQL) are better ingested using tools like AWS Database Migration Service, while real-time and near real-time data streams are the perfect use case for Amazon Kinesis Data Streams and Kinesis Firehose.
Amazon Kinesis Data Streams is a reliable, durable, cost-effective way to collect large amounts of data from the field and from Mobile or web applications. One of the many advantages of Kinesis Data Streams is that you can extend its functionality with custom software to meet your needs exactly. It may store the data it has collected for up to 7 days, and it supports multiple applications producing data for the same stream. You can provide the custom software leveraging Lambda Functions.
Amazon Kinesis Data Firehose fully manages many of the manual processes that Kinesis Data Streams requires, and also includes no-code configuration options to automatically deliver the data to other AWS services. It makes it easy to group the data into batches, and make aggregations. Kinesis Data Firehose streams can be configured with consumers, including Kinesis Data Streams, Amazon Amazon S3, Amazon Redshift, and Amazon ElasticSearch.
Cold data, which is generated by applications that can be periodically batch-processed may be efficiently collected using Amazon EMR or AWS Glue.
Another crucial characteristic to account for is the data volume. The amount of data to be transferred is a large indicator of the services that can be used. Some services, like Kinesis and SQS, have limits on items or record sizes, therefore knowing your input data “chunk size” is essential in order to correctly design the ingestion infrastructure.
Other AWS services have limits on the total size the storage volume can grow to. Also, the overall throughput of the ingestion needs to be accounted for during the design phase to correctly choose the size of the computer capacity, streams, and networking infrastructure.
When storing the data for further processing we need to choose between a data warehouse and a data lake.
A data warehouse is a database optimized to analyze relational data coming from transactional systems and business applications. The data structure and schema are defined in advance, and you can optimize it for fast SQL queries, where the results are typically used for operational reporting and analysis. Data is cleaned, enriched, and transformed so it can act as a central repository.
The standard choice to build a data warehouse on AWS is Amazon Redshift.
With Redshift, you can query petabytes of structured and semi-structured data across your data warehouse, operational database, and your data lake using standard SQL. Redshift lets you easily save the results of your queries on Amazon S3 using open formats like Apache Parquet to further analyze from other analytics services like Amazon EMR, Amazon Athena, and Amazon SageMaker.
A data lake is a central location that can store all your structured and unstructured data, no matter the source or format. It can store both relational data from business applications, and non-relational data from a lot of different sources. The structure of the data (or schema) is not defined when data is captured. This means you can just store the data without knowing what questions you might need answers for in the future. Different types of analytics on your data, such as SQL queries, big data analytics, full-text search, real-time analytics, and machine learning, can be used to uncover insights.
To build a data lake on AWS you can leverage Amazon S3.
Amazon Simple Storage Service (Amazon S3) is an object storage service that offers industry-leading scalability, data availability, security, and performance. It can be used with Amazon Athena, and it also integrates with most services used to build data analytics pipelines.
Amazon Athena is an interactive query service that makes it easy to analyze data in Amazon S3 using standard SQL. Athena is serverless, so there is no infrastructure to manage, and you pay only for the queries that you run. Most results are delivered within seconds. With Athena, there’s no need for complex ETL jobs to prepare your data for analysis. This makes it easy for anyone with SQL skills to quickly analyze large-scale datasets.
Athena is out-of-the-box integrated with AWS Glue Data Catalog, allowing you to create a unified metadata repository across various services, crawl data sources to discover schemas, and populate your Catalog with new and modified table and partition definitions, and maintain schema versioning.
Raw data is rarely useful in final data analytics. It is vital that you carefully prepare the data to help data analysts create the business insights that they require. This is also called data wrangling. You can prepare data in multiple ways and use it in multiple analyses at the same time. Data preparation provides options such as adding calculated fields, applying filters, and changing field names or data types.
Data preparation is a critical but challenging process. To get data ready for analysis, you first extract data from various sources, you then clean it, transform it into the required format, and load it into databases, data warehouses, or and data lakes for further analysis.
On AWS you can perform these tasks using the following services: Amazon Kinesis Data Analytics, Amazon Sagemaker Preprocessing, Amazon EMR, and AWS Glue.
If you want to analyze streaming data, both real-time and near real-time you can directly leverage Kinesis. Amazon Kinesis Data Analytics, which is a great tool for basic data transformations on streaming data using SQL commands.
Amazon Sagemaker Preprocessing allows you to easily start on-demand EC2 instances to run pre-defined transformations jobs. This is often useful to run simple cleaning and preprocessing jobs on small amounts of data for which Glue or EMR would be a bit overkilling.
Amazon EMR is the AWS big data platform for processing vast amounts of data using open source tools such as Apache Spark, Apache Hive, Apache HBase, Apache Flink, Apache Hudi, and Presto.
AWS Glue is a serverless Spark-based data preparation service that makes it easy for data engineers to extract, transform, and load (ETL) huge datasets leveraging PySpark Jobs.
Data analysts and data scientists can also use AWS Glue DataBrew to visually clean up and normalize data without writing code. Furthermore AWS Glue Studio can also be used to visually create more articulated data transformation Glue Jobs.
At this stage of the data analytics process, data is usually curated, cleansed, and aggregated into useful information for the purpose of the analysis.
Once you have all the information required it’s time to visualize and analyze them to get the needed insights.
To visualize your processed data and the result of the analysis you can leverage Amazon Quicksight. Amazon QuickSight is a fast, cloud-powered business intelligence service that makes it easy to deliver insights to everyone in your organization. As a fully managed service, QuickSight lets you easily create and publish interactive dashboards that can be accessed from any device, and embedded into your applications, portals, and websites.
Data visualization can be integrated with machine learning results in order to provide: descriptive, diagnostic, predictive, prescriptive, and cognitive data analysis.
The Descriptive analysis answers the question: What happened? It focuses on hindsight and is often called data mining.
The Diagnostic analysis answers the question: Why did it happen? It focuses on hindsight and insight. This form of analysis is used to compare historic data with other data from different sources. Using this method is possible to find dependencies and patterns that can lead to the answers.
The Predictive analysis answers the question: What will happen? It focuses on insight and foresight. This form of analysis uses the results of the descriptive and diagnostic analysis to predict future events and trends. The accuracy of this method is highly dependent on the quality of data and stability of the situation being predicted. The Prescriptive analysis answers the question: What should I do? It focuses on foresight. This form of analysis is used to prescribe actions to take based on the data provided. This type of analysis requires input from all other forms of analytics, combined with rules and constraint-based optimization, to make relevant predictions. The greatest advantage of this form is that it can be automated. Machine learning makes this possible.
The Cognitive and artificial intelligence answers the question: What are the recommended actions? It focuses on foresight and hypothesis input. This form of analysis tries to mimic what the human brain does in problem-solving. Cognitive analytic systems generate hypotheses from existing data, connections, and constraints. Answers are provided in the form of recommendations and a confidence ranking.
This was our quick introduction to data analysis on AWS.
What are your next-future data-related projects? Let us know!
Follow #Proud2beCloud and stay tuned for more articles about data analytics on AWS!