Enabling enterprise Telemetry on AWS: Handling massive data backfills using ECS and Databricks wi...
17 June 2026 - 1 min. read
Keidi Xhafa


Today more than ever, companies understand the actual potential value of data. Therefore, ETL solutions are increasingly common and varied.
In this article, we will talk about an ETL pipeline that uses a not-so-widely adopted integration in this kind of use case to adhere to business needs.
Extraction, Transformation, and Loading (ETL) is now a standard pattern for data pipelines. The extraction step gathers data from various sources: having a properly organized Data Lake here is the key to accomplishing this step seamlessly. Once you have data, you can apply every kind of transformation needed to extract the best value from the data. These processing steps, summarized in what is called the “transformation step”, are very specific to every use case. Their output is finally stored to save it for later: this is the “loading step”.
Outputs can now be queried and visualized to have insights that can help and guide decisions. The benefit of this structured process is the ease of modifying or implementing an additional transformation. The time needed to do it drastically reduces, giving an enormous advantage in answering arising business questions that can be key drivers for management decisions.
Every step can be accomplished in several ways, in this article we will show you one of the possible ways to do it, with some advice to do it in the best way.
Before starting up with the description of the technical solution, let’s contextualize this data flow. The idea here is a service where people subscribe and send a continuous stream of data while using the application, which has to be stored and processed near-real time. The correct data ingestion without data loss is key for this data flow. Components must be able to scale efficiently.
Now that we have the full picture, we can start describing the building blocks of the technical solution. We'll explain their features, how to connect them and how they interact with each other.
SNS service can send messages via several protocols, from classic emails and messages, and endpoint requests - like HTTP/HTTPS - to direct integrations with AWS services, like SQS, Lambda functions, and Kinesis Data Firehose. For these reasons, SNS topics are a fantastic way to decouple pieces of your infrastructure.
The SNS topic will send data to multiple subscribers: a Kinesis Delivery Stream and an SQS queue. We can also use an email subscription to get notifications for a subset of the input using SNS filters.
The idea is to process input data and, at the same time, store it with a different part of our infrastructure so that we can both visualize it and, if we need it, re-process it later with other transformations or even with an updated version of our data flow. Hence, the SNS topic will interact with both the extraction and transformation components of the ETL flow: the Delivery Stream will store input data that will become part of our Data Lake, meanwhile, the SQS queue will direct the same data to the selected processor that will do the transformation.
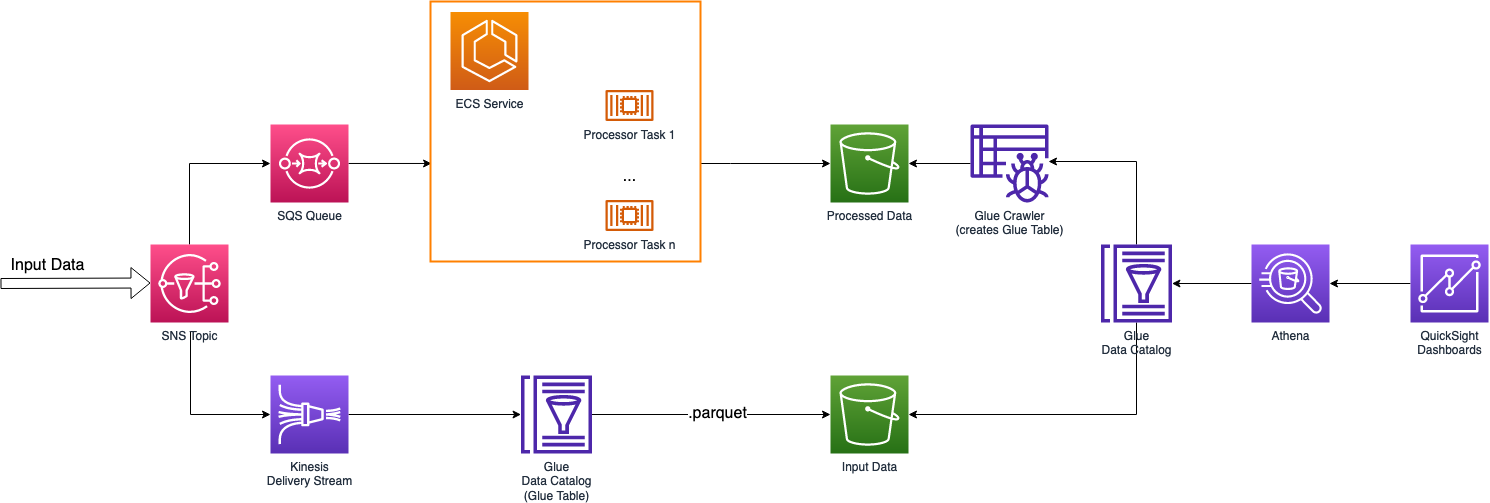
Kinesis Delivery Streams can aggregate input data, batching them into single files. This is exactly what we need to achieve the first goal.
A delivery stream will batch our input data for short periods of time, or up to a given threshold of MBs, storing it in a compressed format, like parquet or orc, on S3. The SNS topic will direct data to both Kinesis and the processor; therefore, we can set 3 minutes to batch the input.
We will store .parquet files on an S3 bucket under a folder called “data”, partitioning them by year, month, and day with this expression:
data/year=!{timestamp:yyyy}/month=!{timestamp:MM}/day=!{timestamp:dd}/The choice of parquet format is given by the fact that they can be easily queried via S3 Select, Glue, and Athena. Parquet files are structured, therefore, our Kinesis Data Firehose needs to have the data structure definition for the output data structure in some way.
About this, one important note: you can even have a Lambda function as a transformer for the Delivery Stream. The lambda can do every kind of processing, from simple validation to complete restructuring of the input data, perhaps adding new fields. The structure definition needed by Kinesis Data Firehose to batch data into parquet files must reflect the output data because it’s the one that will be stored on S3. In this specific case, we are using Kinesis Delivery Streams to store our input. We don't need a Lambda transformer, therefore, our data structure will be equal to the input data structure.
The way to communicate data structures to Kinesis is via AWS Glue services, specifically, using Glue Data Catalog features. We need to create a Glue database with a Glue table inside it: the table will hold the data structure and will be used by Kinesis service to generate parquet files.
Now that we have achieved input storage, we need to find a way to process our input.
Input processing can be done in several ways. As described earlier, the SNS subscribers set is wide. From direct Lambda function integration, SQS queues, to API endpoints to notify heterogeneous types of processors.
Our use case requires near real-time processing; therefore, we have created an SQS queue that is polled by an ECS service. The service scales out the number of tasks depending on the load on the queue.
The input processing can be very different depending on the use case. This time, we started with input validation by checking that all needed fields are present. This check is needed to ensure that no one has tweaked the application, trying to interact with it in malicious ways. Moreover, we ensure with data type checks, that the input suits the processing methods. Valid data will continue its processing while data containing mistakes is categorized and, depending on the error, notified or stored in a different part of the infrastructure.
The actual processing of the input can be divided into three main parts: data flattening and cleaning, obfuscation, and data aggregation. First, we flatten the nested fields of the input, filtering out fields that are not used by the platform. Meanwhile, we parse some fields, preparing them for future steps. Next, we obfuscate our input. We won’t get much into this process because it’s very specific to the given data flow and outside the scope of this article. The idea is to hide sensitive information contained in the input data, like personal information. In this specific case, we are using data masking to hide PII. Finally, we aggregate the data to extract metrics and gather information from them.
This time, we are interested in finding places where we have an aggregation of people, therefore, we need to count the number of persons present inside a given radius with information about their age and gender. Finally, the loading step of the ETL process: we store aggregated data in an S3 bucket so that we can inspect it later.
At this point, we have our data, input and processed, stored inside S3 buckets, we can do our analysis and gather insights from them. We may want to do the main activities: querying and visualizing our results.
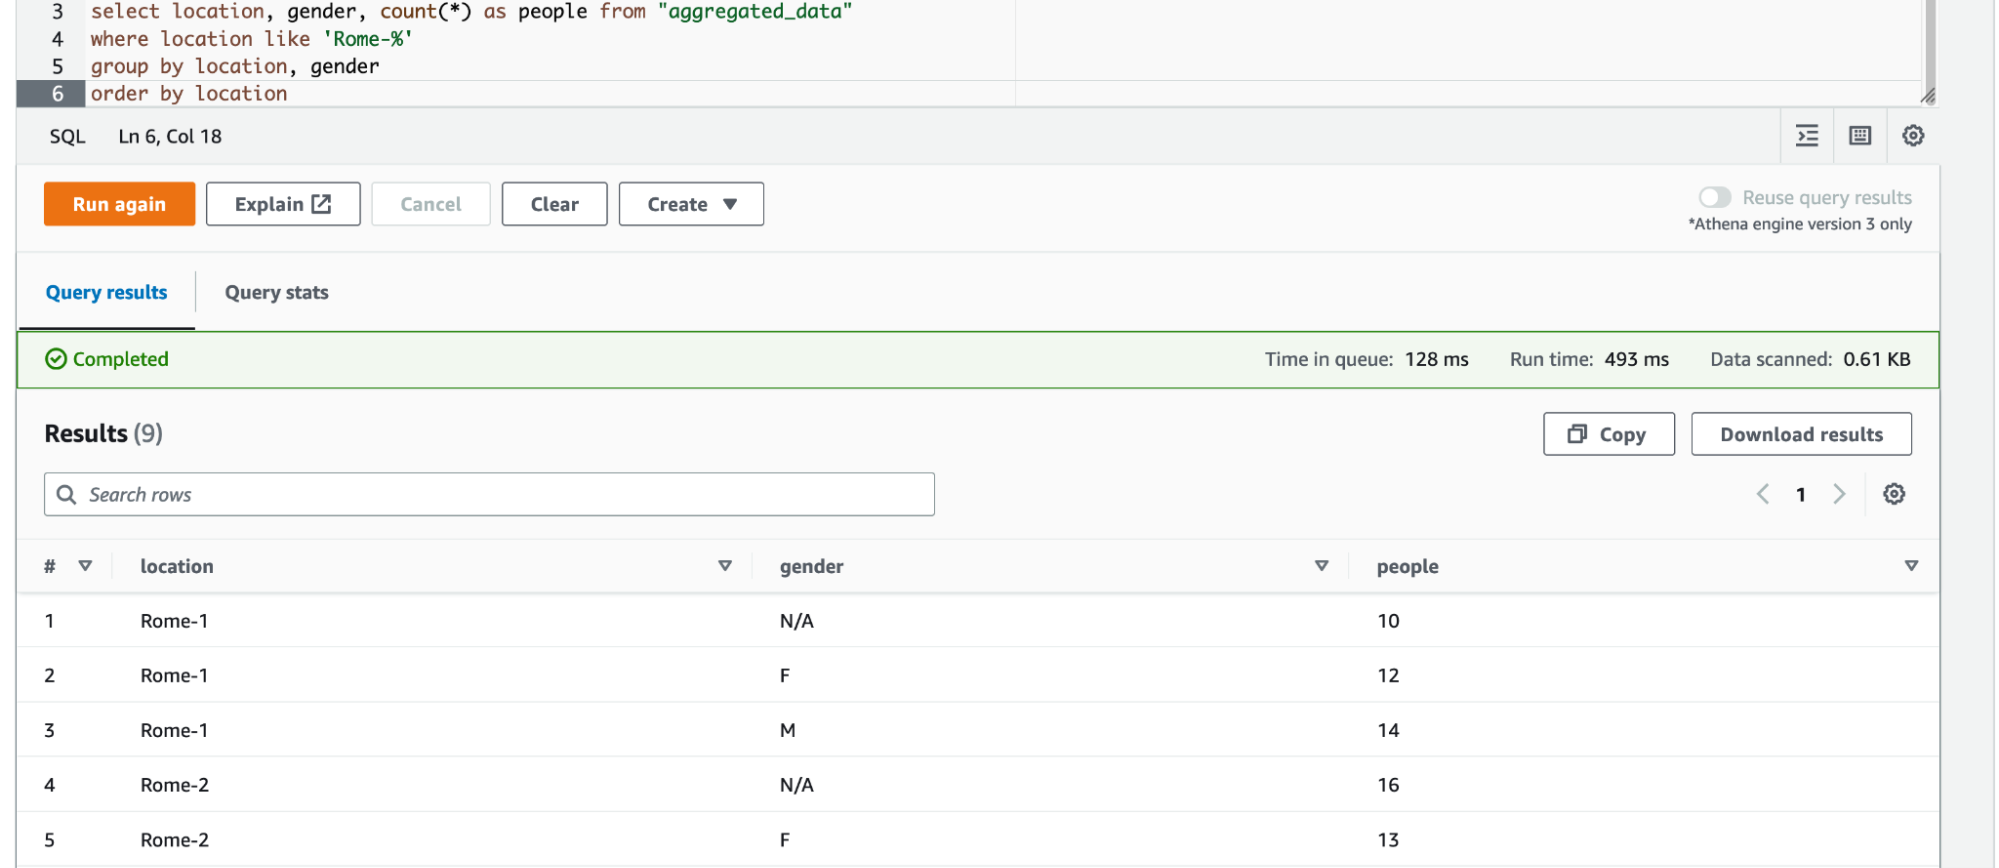
First, we may want to do SQL queries on our data in S3. To do so, we can use AWS Athena service. Athena can query data both directly from S3 buckets or from the Glue Data Catalog. As described earlier, we already have created a Glue database and a Glue table inside the data catalog for our input data from Kinesis Firehose. We can do the same for our aggregated data using another service from Glue: the Glue Crawler. With few configurations, we can point our Glue crawler to an S3 location, where we have the aggregated data, and the crawler will infer data schema, creating a Glue table that reflects it. We suggest following this option because the crawler can be used multiple times so if we change the data processing, thus the output data structure, the crawler will automatically update the schema.
Now we can easily query our data, both input and aggregated, with Athena, gaining information, as an example, about the number of people around interest points, grouped by gender.
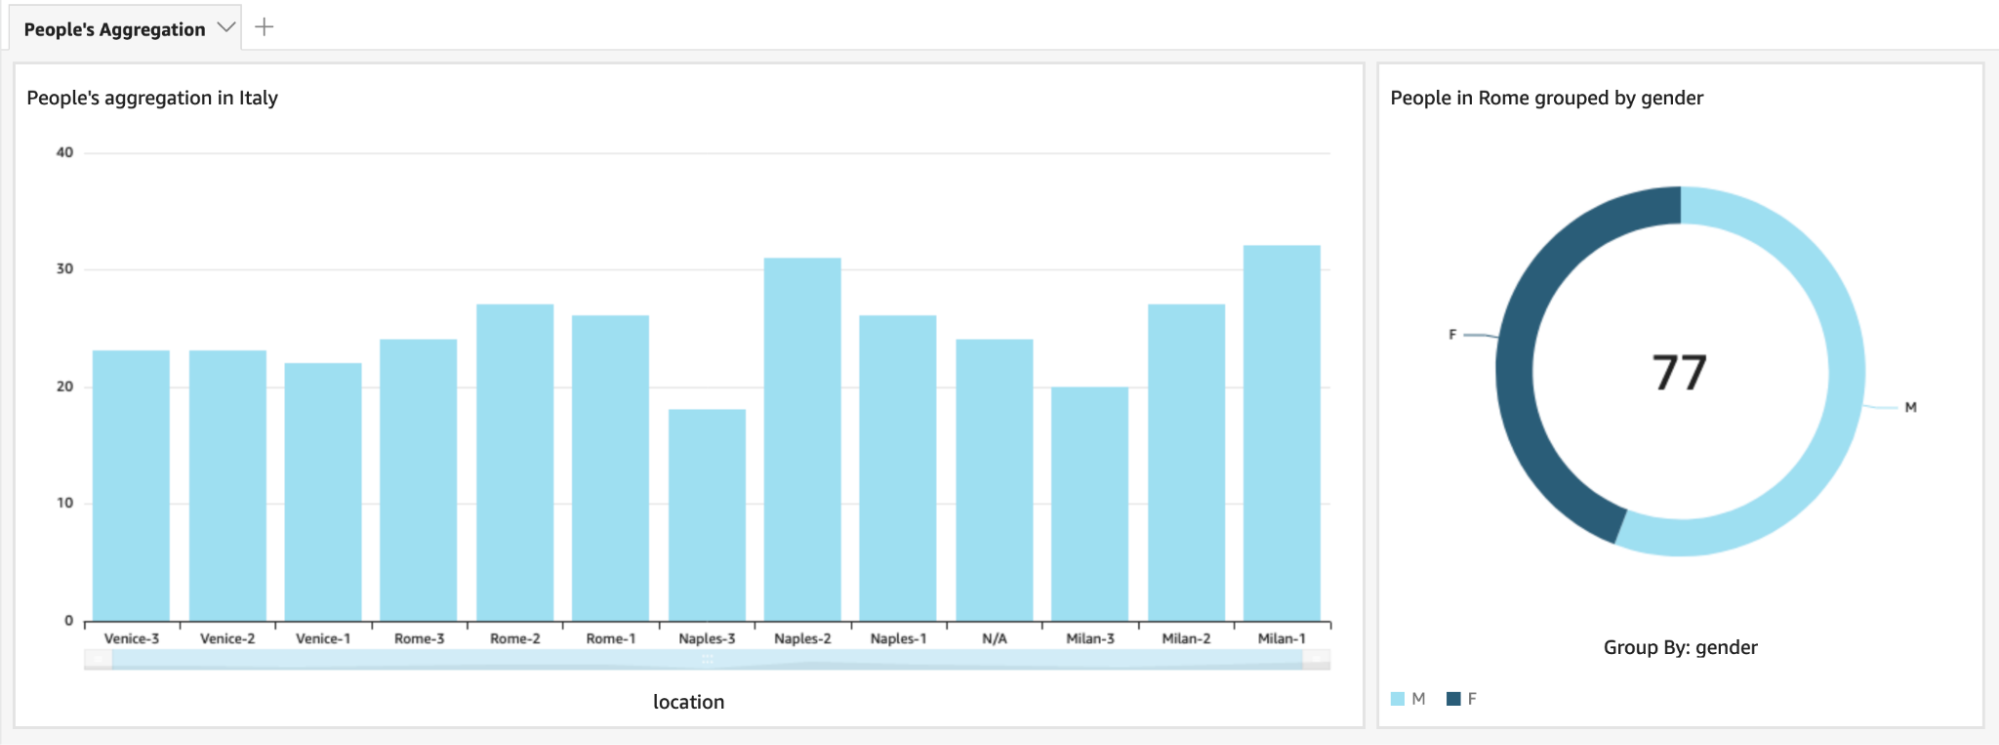
Data visualization will be fairly easy to do. We can leverage AWS QuickSight power to create dashboards in a matter of minutes. To do so, we just need to create two datasets in QuickSight, one for input data, and another one for the processed one. QuickSight datasets can use various sources; we will use Athena as source for both our datasets.
Once we have our datasets, we can start manipulating them with QuickSight analysis so that we can customize our visualization and, finally, when we are happy with the result, we can save the analysis as a QuickSight dashboard that we can expose to the viewers.
Now we can inspect our dashboard to instantly have a clear view of people’s aggregation to our points of interest.
In this article, we have explored the ETL world, giving a grasp of every single part: extraction, transformation, and loading and a possible implementation of them in the AWS Cloud. In this journey, we have learned how to decouple pieces of infrastructure with SNS topics and how we can leverage them to notify multiple components with the same input. By doing this, we were able to notify both the Extraction and the Transformation components at the same time, processing near-real time our input data.
We have described a possible way of storing source input in a compressed format, parquet, with Kinesis Delivery Streams. In doing so, we explored some of the AWS Glue services, from the Glue Data Catalog (Glue databases and tables) to Glue crawlers that give us the possibility of integrating external data sources directly into our Data Lake.
Moreover, we have shown a possible way of processing our inputs with SQS queue and ECS tasks. Here we gave some ideas about standard data processing techniques, but usually, these are very specific to the given process.
Finally, we have delineated how to query our data with AWS Athena and how to create and share visualizations with AWS QuickSight.
One last bit before the end: data flows usually are very specific for the given context, feel free to experiment in every step. From different data sources, like databases, to every kind of transformation that you can think about. Moreover, here you may try different types of processors, perhaps, a Lambda function suits your needs. Finally, this is the part where you can experiment the most with your creativity: try to create different kinds of visualizations, from standard histograms to crazy filterable multi-line plots or whatever can give you insights at a glance.
Let us know if you liked this article and want to learn more about some of the topics mentioned!
Stay tuned for other articles about Data analytics and ETL.
Proud2beCloud is a blog by beSharp, an Italian APN Premier Consulting Partner expert in designing, implementing, and managing complex Cloud infrastructures and advanced services on AWS. Before being writers, we are Cloud Experts working daily with AWS services since 2007. We are hungry readers, innovative builders, and gem-seekers. On Proud2beCloud, we regularly share our best AWS pro tips, configuration insights, in-depth news, tips&tricks, how-tos, and many other resources. Take part in the discussion!