When Serverless runs on servers: new options for AWS Lambda and AWS Fargate with Managed Instances
04 March 2026 - 13 min. read
Damiano Giorgi
DevOps Engineer

Nowadays it is increasingly important to be able to monitor and track the status of your applications, as well as being able to easily identify the source of problems. Counting the ever increasing number of digital services, regardless of their size and importance, this need is increasingly felt.
For some time we are also working with many modern and complex infrastructural patterns, such as microservices and serverless. Effective and centralized tools for monitoring must be found.
Far be it from me to describe and compare the various logging management programs, a single article would not be enough! We can say, however, that in the AWS world these problems are significantly reduced thanks to the numerous alternatives we have available, together with the advantage of fully managed services!
In this article we will talk about how to centralize and efficiently manage logs from various applications, remaining entirely on the AWS world! Specifically, we will explore an alternative to the popular log aggregation solution, the ELK stack (Elasticsearch, Logstash, Kibana), or the EKK stack (Amazon Elasticsearch Service, Amazon Kinesis and Kibana).
Let's start with a brief description of the ELK stack. For those of you who know it, let's review together! As in history, also in information technology it is useful to know the past to better understand the present.
Starting from the diagram below, the ELK stack is composed of the following components:
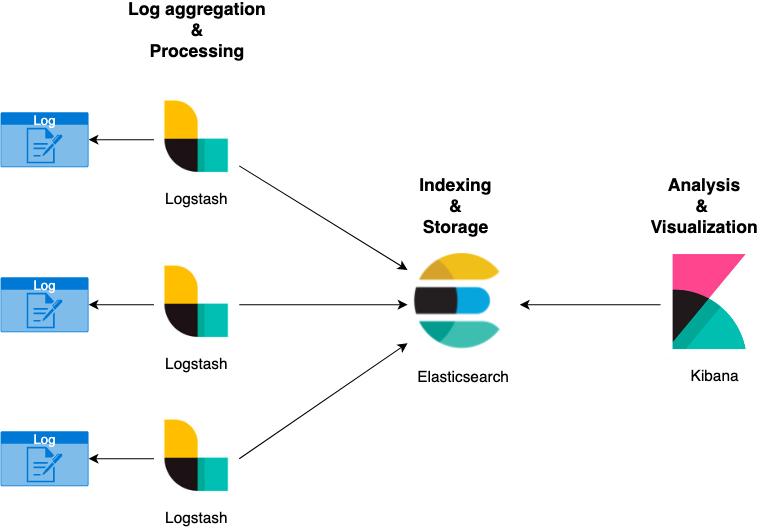
Presented in this way, the simple "logging" management of our application could be relatively complex. However, this stack is used extensively today due to its versatility and scalability.
But we are not going to talk about this structure, indeed we’ll describe its cloud-native “fork” on the AWS world! In fact, we will deal with the EKK stack, the components that come into play become:
The infrastructure diagram transforms as follows:
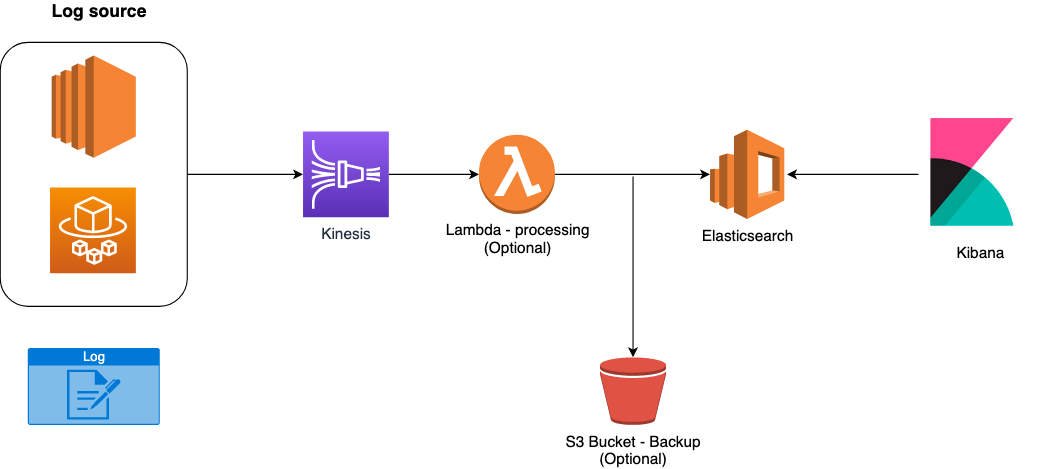
Convenient isn't it? Forget the provisioning and management of EC2 machines, as well as their scaling, maintenance and configuration in high availability. These services, fully managed by AWS, come to our rescue by allowing us to focus on our application and reduce costly activities, in terms of time, for the "trivial" infrastructure linked to the aggregation and presentation of logs.
For the more suspicious, having to send data to Firehose may not be the best choice. So, let’s describe the advantages of the proposed solution.
First, there is a native integration between Kinesis and Elasticsearch managed by AWS! Furthermore, we can decide to carry out processing activities on all incoming data, indeed, by using AWS Lambda, we can format the incoming logs from all source systems.
It is not enough? On Kinesis we can also select an S3 bucket to save logs, so they will be available in the future for any analysis or replication to other platforms.
To reduce costs, nothing prevents us from moving data to a different S3 Tier cheaper than the Standard one.
Among the functions offered by Kinesis, there is also that of batching, encryption and retry mechanism to better manage requests to the Elasticsearch server.
But which sources can we use with Kinesis? Ideally, any! In fact, it is possible to directly call the APIs (for example, those provided by SDKs), or we can use tools already provided by AWS if we are using its best-known computing services.
Let's take some examples:
In summary, we have seen how to bring the classic ELK stack back into an AWS cloud-native perspective, then transforming it into an EKK stack to take advantage of the benefits of AWS managed services.
Can't wait to do some practice? Perfect! Let's do a short demo using an ECS cluster in Fargate mode!
Before starting with the demo, let's describe the services we are going to use:
Here is our Fargate cluster with the service created for the demo, blog-ekk:
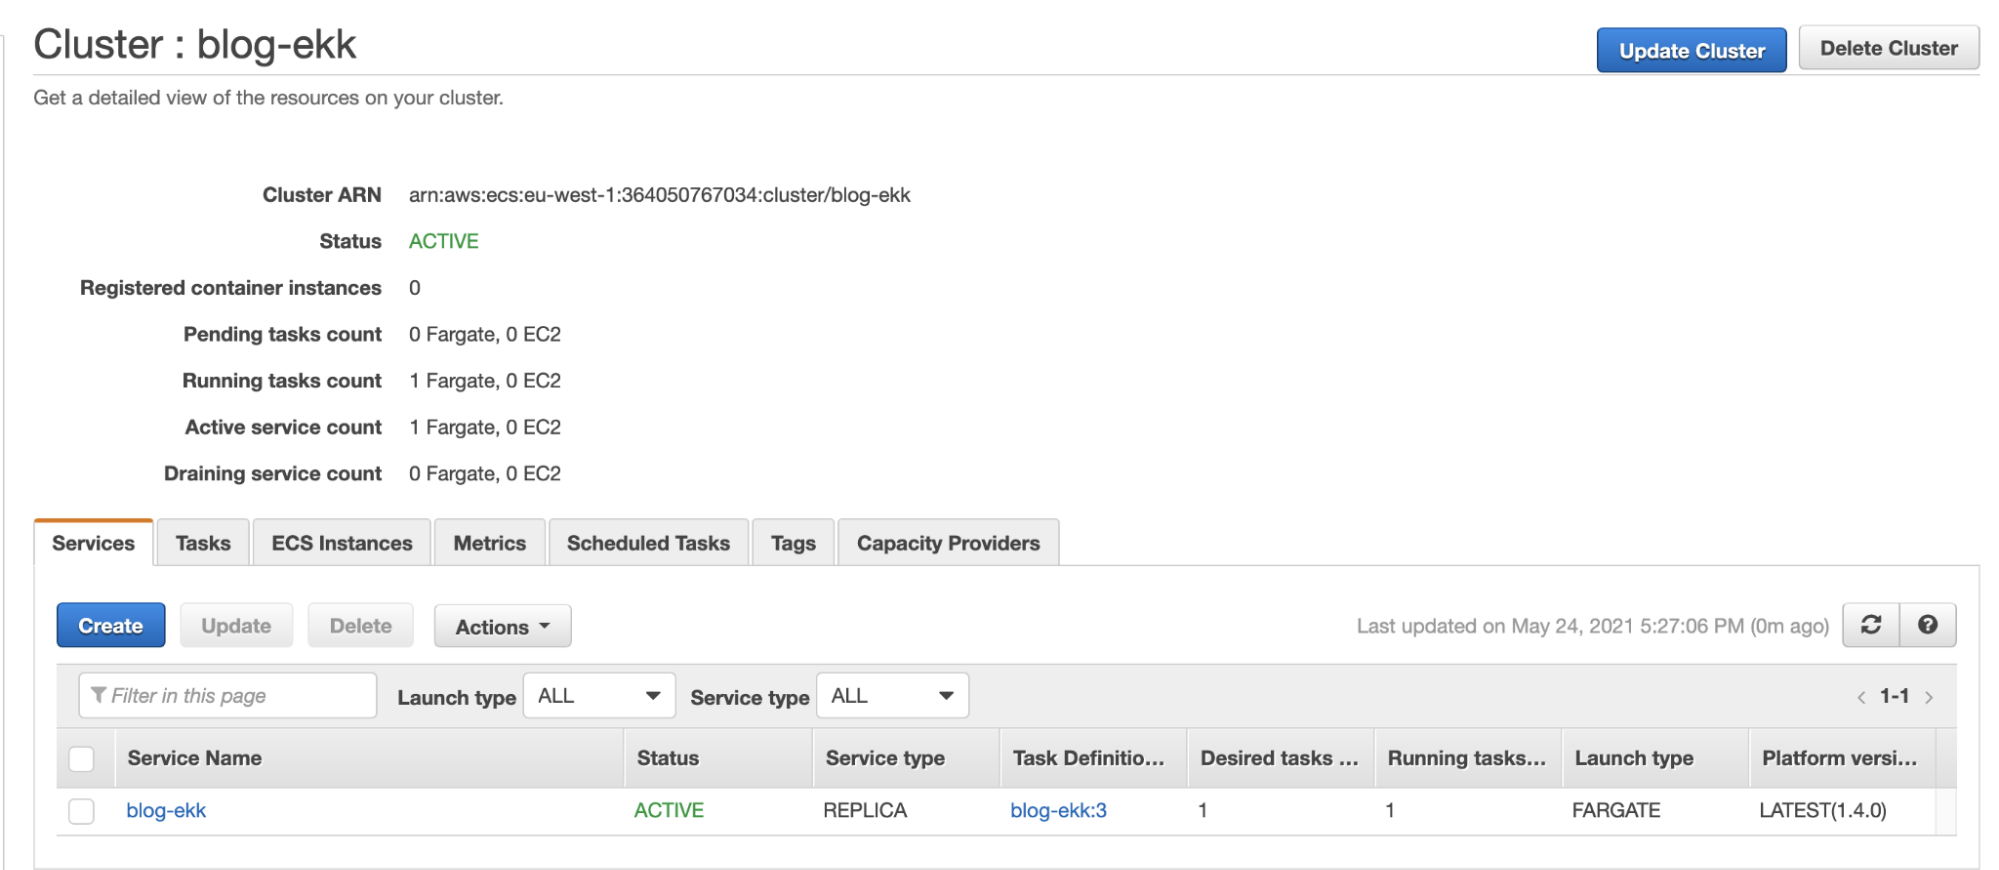
Particular attention is to be paid in the definition of the task definition, we will in fact use FireLens for the native integration between Fargate and Firehose:
FireLens is a log driver for containers hosted on Amazon ECS that extends its log management capabilities. It relies on FleuntD and Fluent Bit.
Below is a simplification of the task definition used by us:
{
	"family": "firelens-example-firehose",
	"taskRoleArn": "arn:aws:iam::XXXXXXXXXXXX:role/ecs_task_iam_role",
	"executionRoleArn": "arn:aws:iam::XXXXXXXXXXXX:role/ecs_task_execution_role",
	"containerDefinitions": [
		{
			"essential": true,
			"image": "amazon/aws-for-fluent-bit:latest",
			"name": "log_router",
			"firelensConfiguration": {
				"type": "fluentbit"
			},
			"logConfiguration": {
				"logDriver": "awslogs",
				"options": {
					"awslogs-group": "firelens-container",
					"awslogs-region": "eu-west-1",
					"awslogs-create-group": "true",
					"awslogs-stream-prefix": "firelens"
				}
			},
			"memoryReservation": 50
		 },
		 {
			 "essential": true,
			 "image": "your-image-uri",
			 "name": "app",
			 "logConfiguration": {
				 "logDriver":"awsfirelens",
				 "options": {
					"Name": "firehose",
					"region": "eu-west-1"",
					"delivery_stream": "blog-ekk"
				}
			},
			"memoryReservation": 100
		}
	]
}
If you use the graphical interface to create the task definition, once the container is configured, by modifying the log router in firelens, the side container that relies on FluentBit will automatically appear (container image: amazon / aws-for-fluent -bit: latest)
Don't forget to change the task definition role to have permission to write to Firehose!
Perfect, the sender system has been configured! Let's now move to the definition of the ingestion system: Kinesis Firehose!
Its configuration is relatively simple. In our case we used S3 as a backup, Elasticsearch as destination and no Lambda transforms.
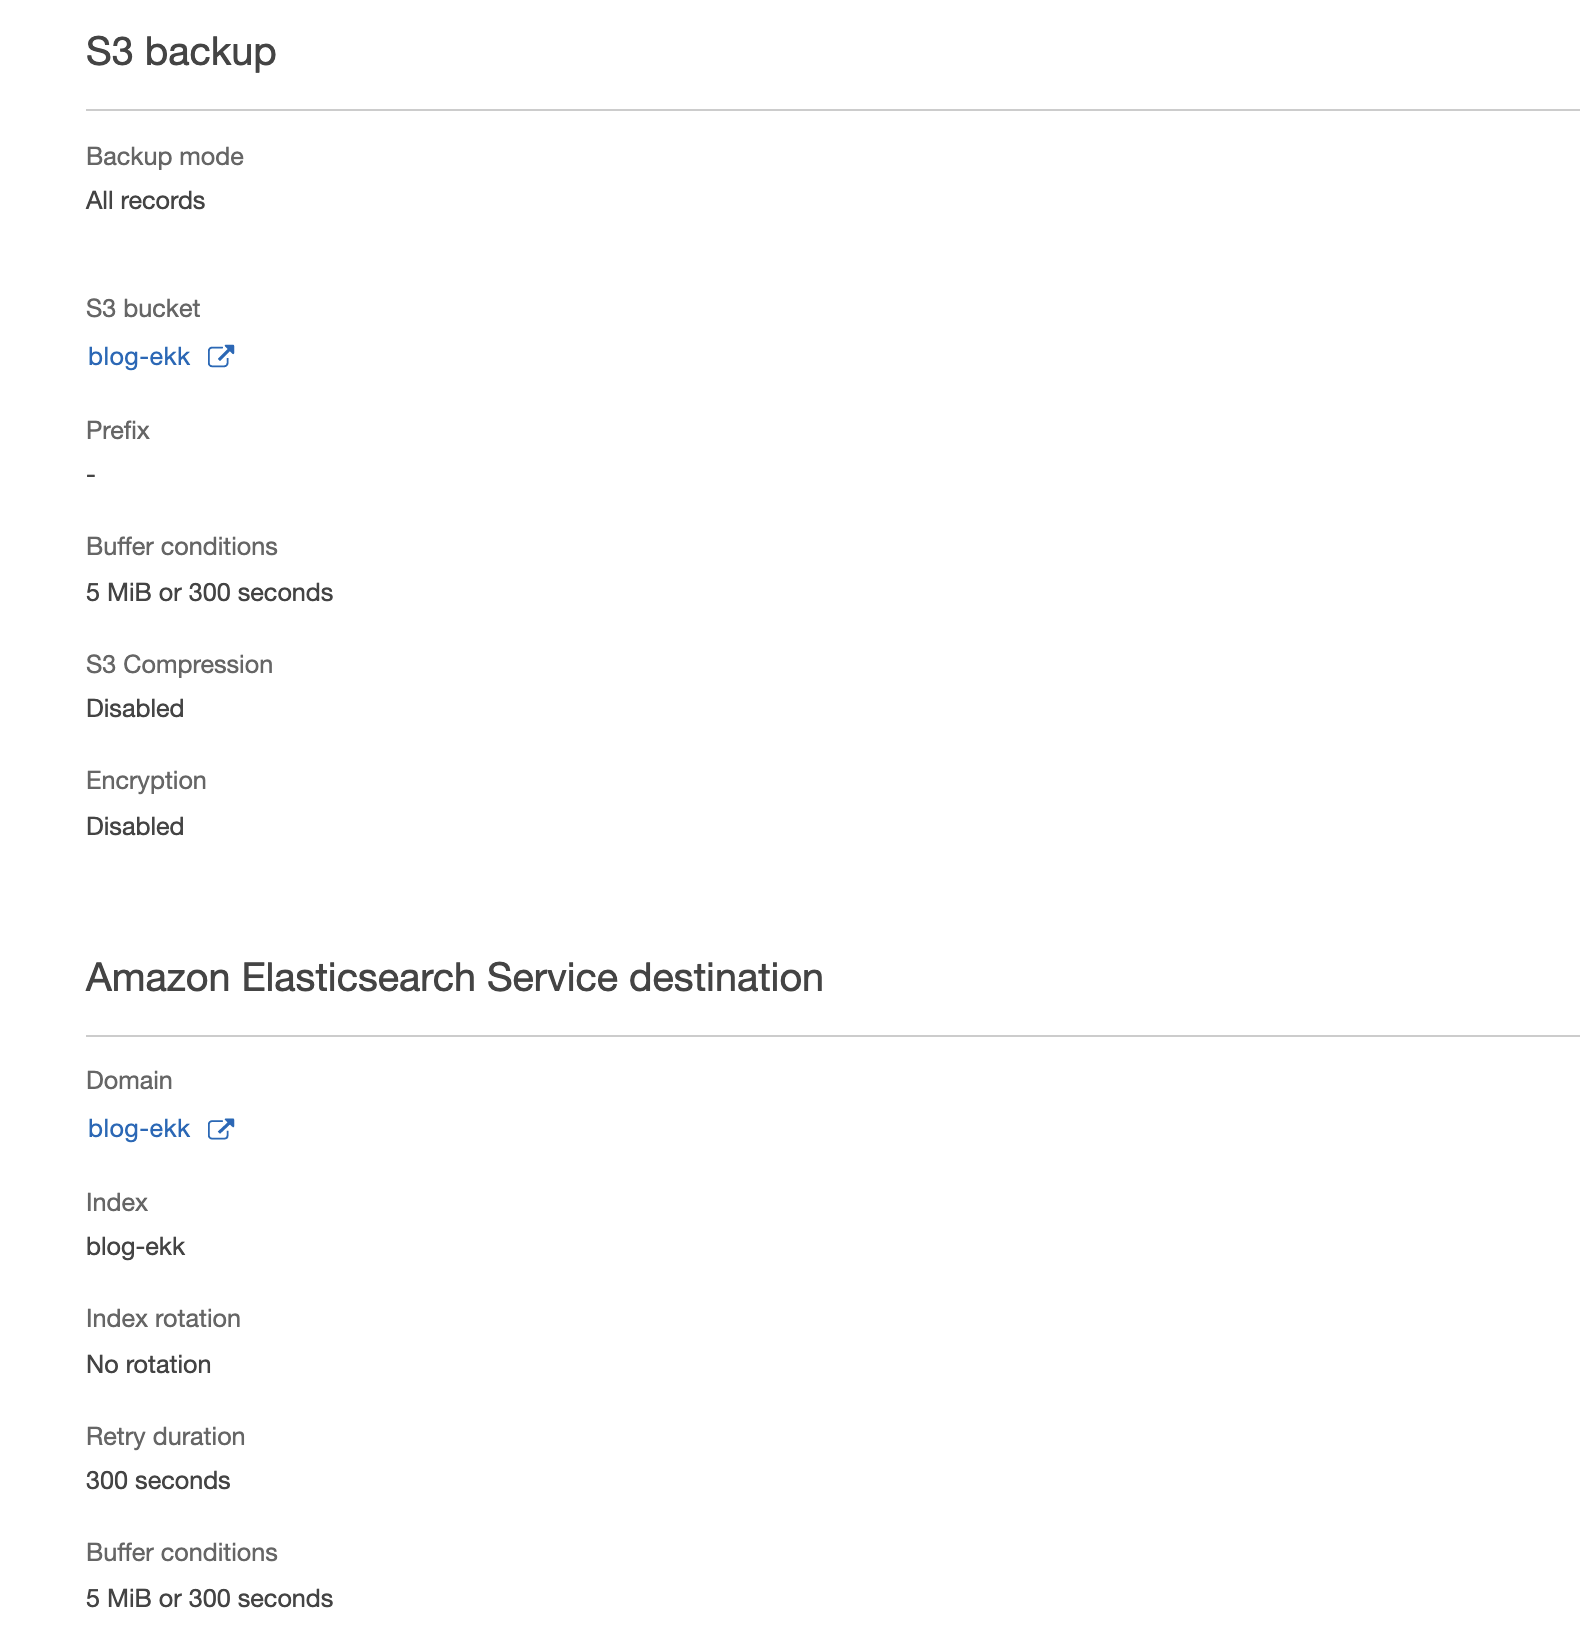
Have you configured everything? Make sure your ECS Service is up and running, in the log section you can check that the side container is actually forwarding the logs to Kinesis.
For further verification, you can check from the metrics on Kinesis for correct reception and forwarding to the Elasticsearch server.
We just have to enter the Elasticsearch domain, on the overview page we will find the address to access Kibana. In our case, access will be authenticated using a username and password saved and managed by Cognito:
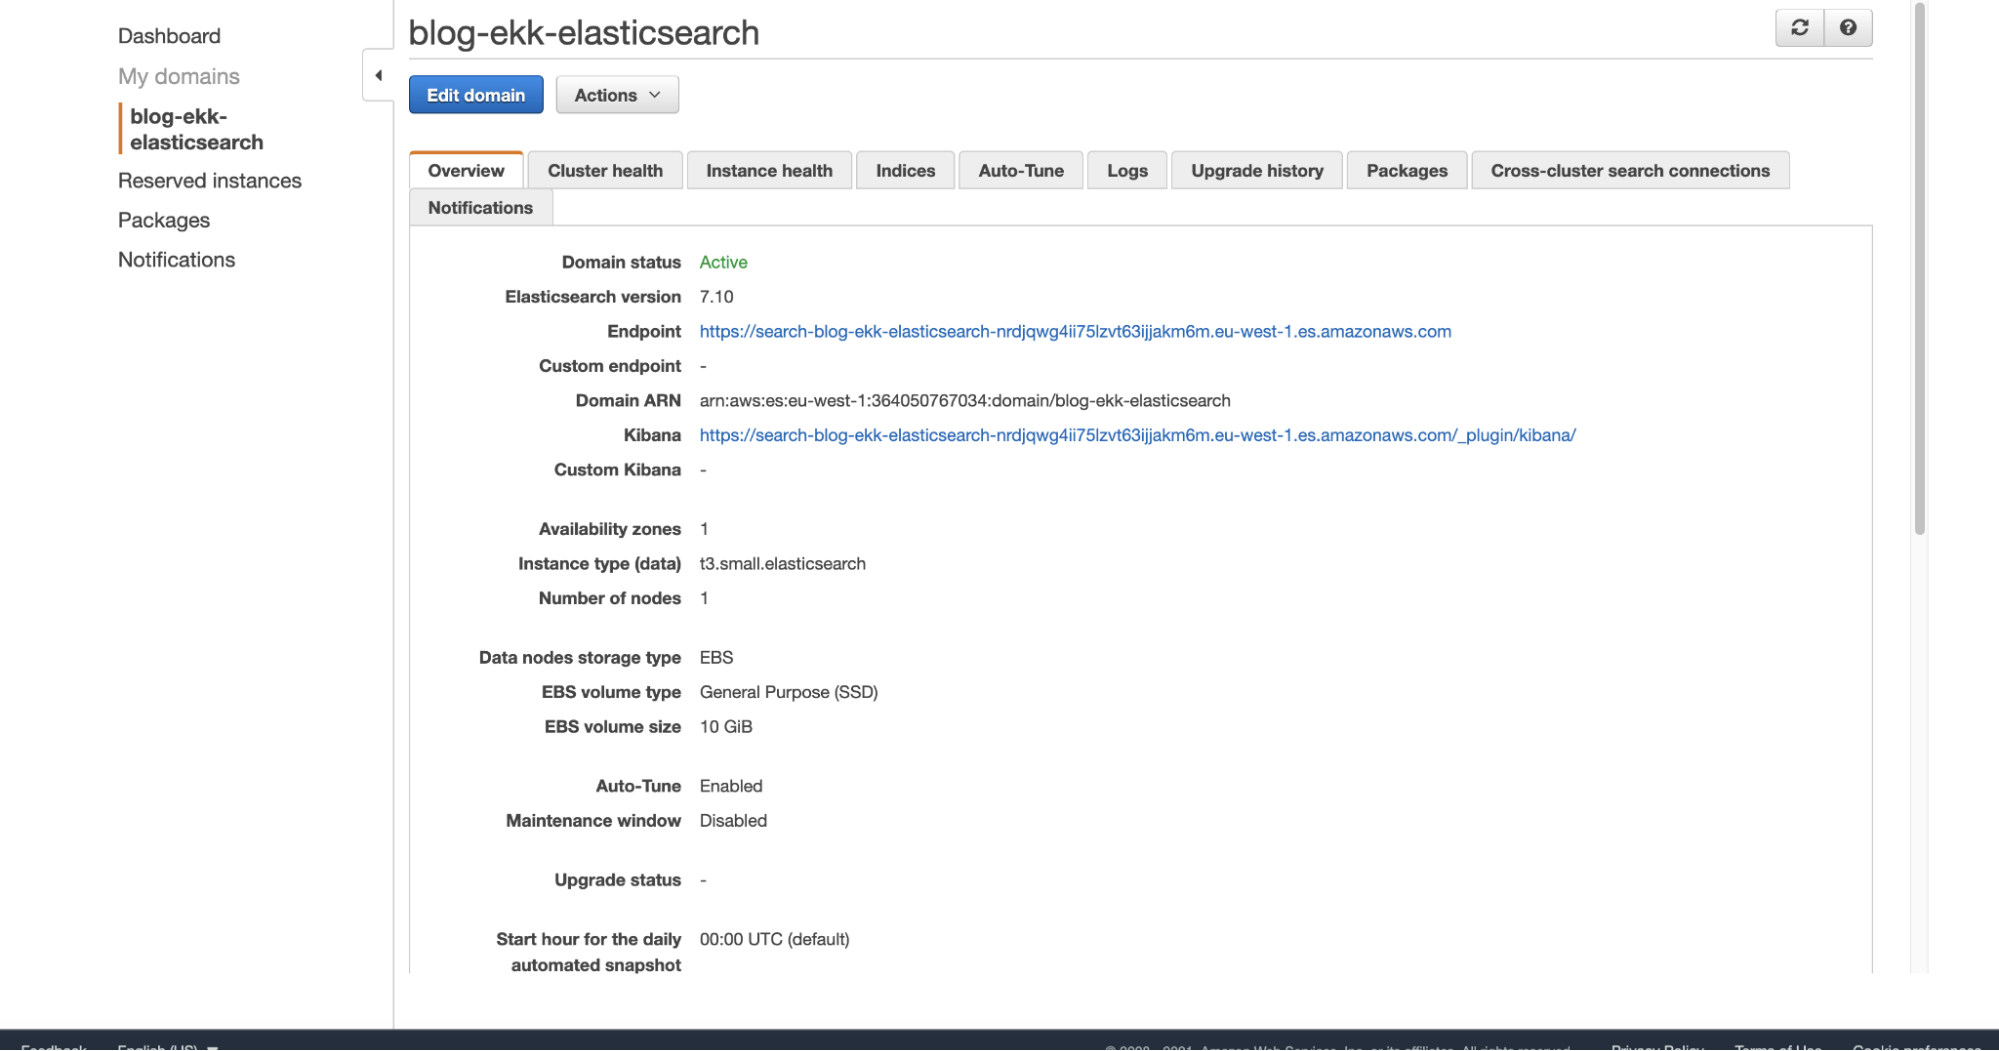
And here is our dashboard on Kibana:
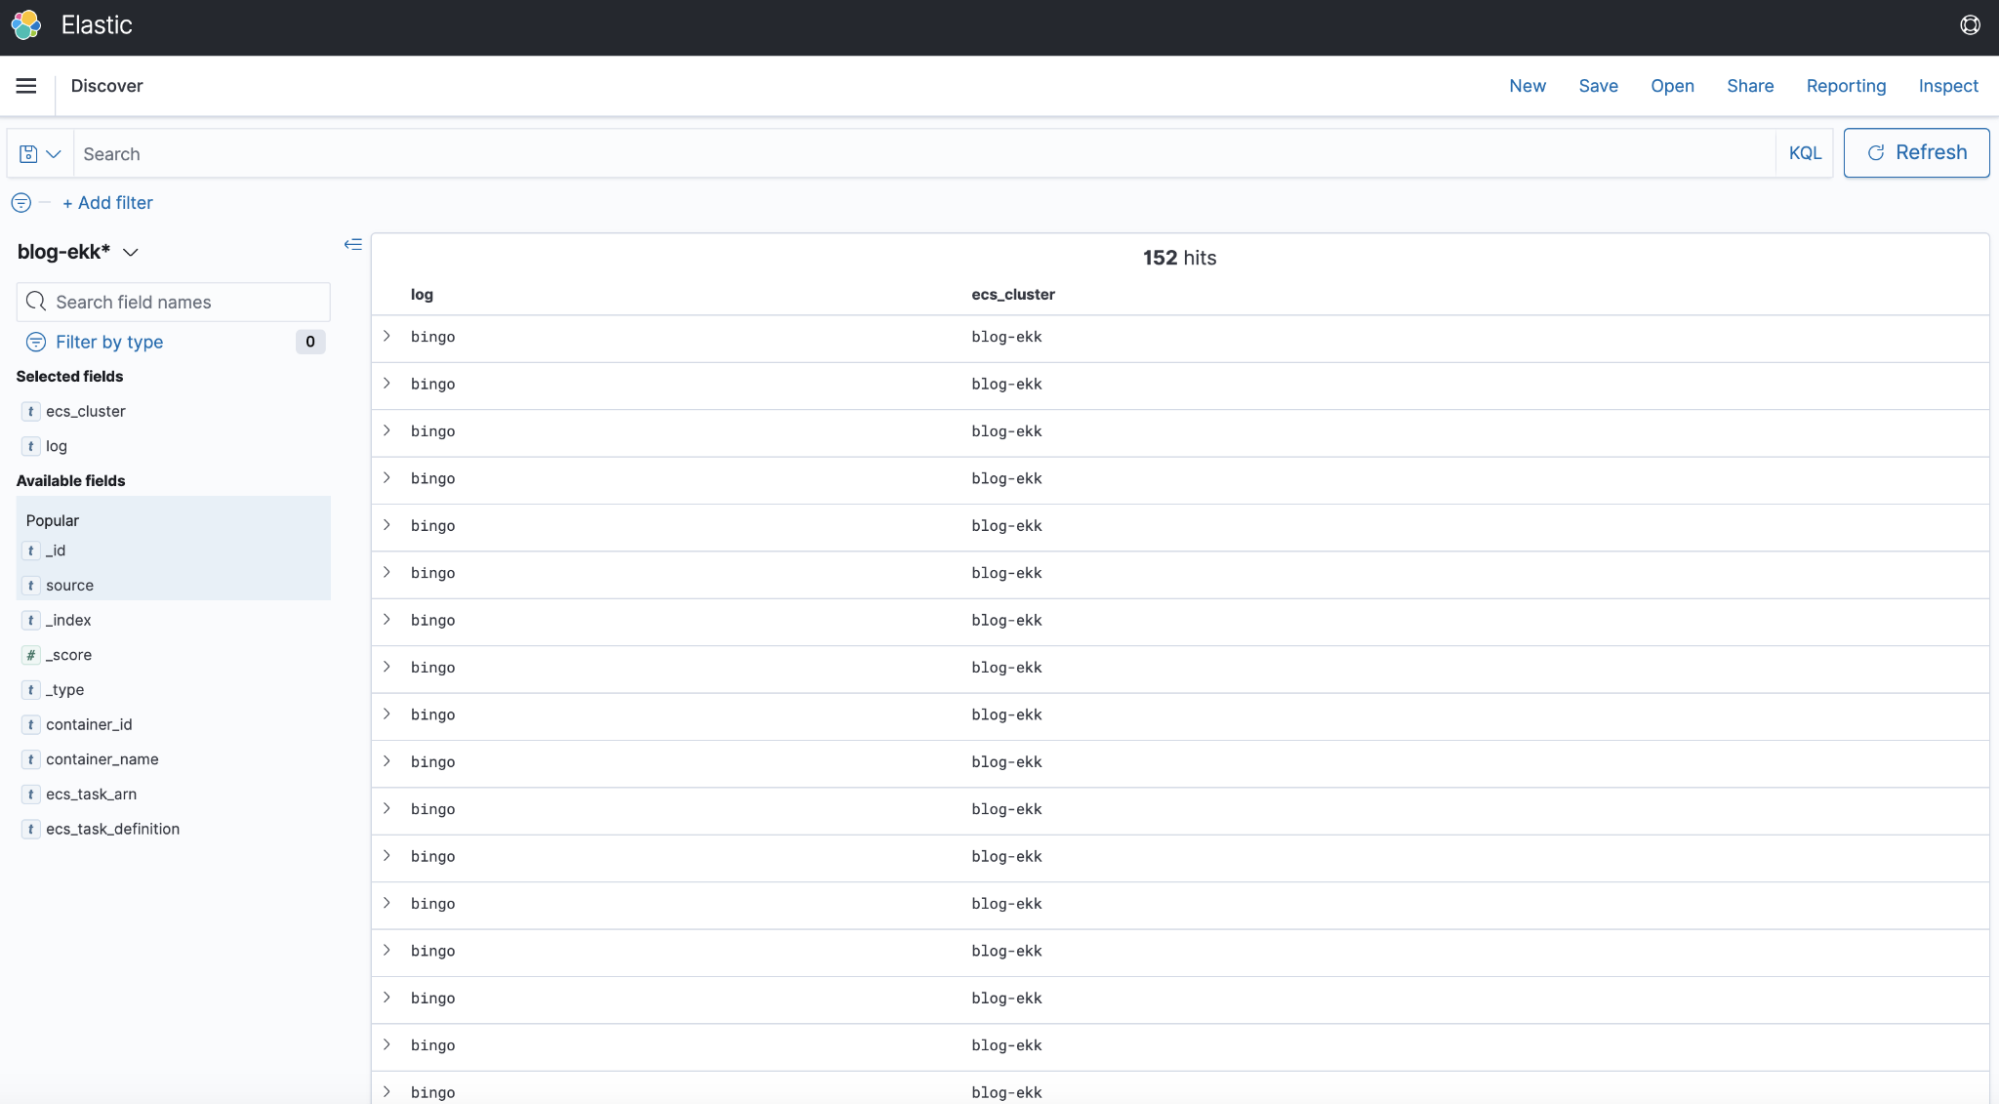
The behavior is as expected, we have in fact created a simple container that writes "bingo"
To conclude, in this article we have described the benefits of the EKK stack, an AWS cloud-native version of the classic ELK stack.
We then saw which AWS services can be used as source system, deepening the case of containers hosted on ECS in Fargate mode.
Do you want to deepen this modality with a step-by-step guide? Or maybe you are curious about the solution starting from EC2 machines? Write us in the comments, and we will try to accommodate your requests!